Skip to content
Excel Unlocked

Let's Unlock the Power of Excel for You

  • Functions
  • Tips and Tricks
  • Charts
  • VBA and Macro
  • About Us
Excel Unlocked
  • Functions
  • Tips and Tricks
  • Charts
  • VBA and Macro
  • About Us

Charts

This category is dedicated to covering all the Charts of Excel.

XY Scatter Chart in Excel – Usage, Types, Inserting Scatter Chart

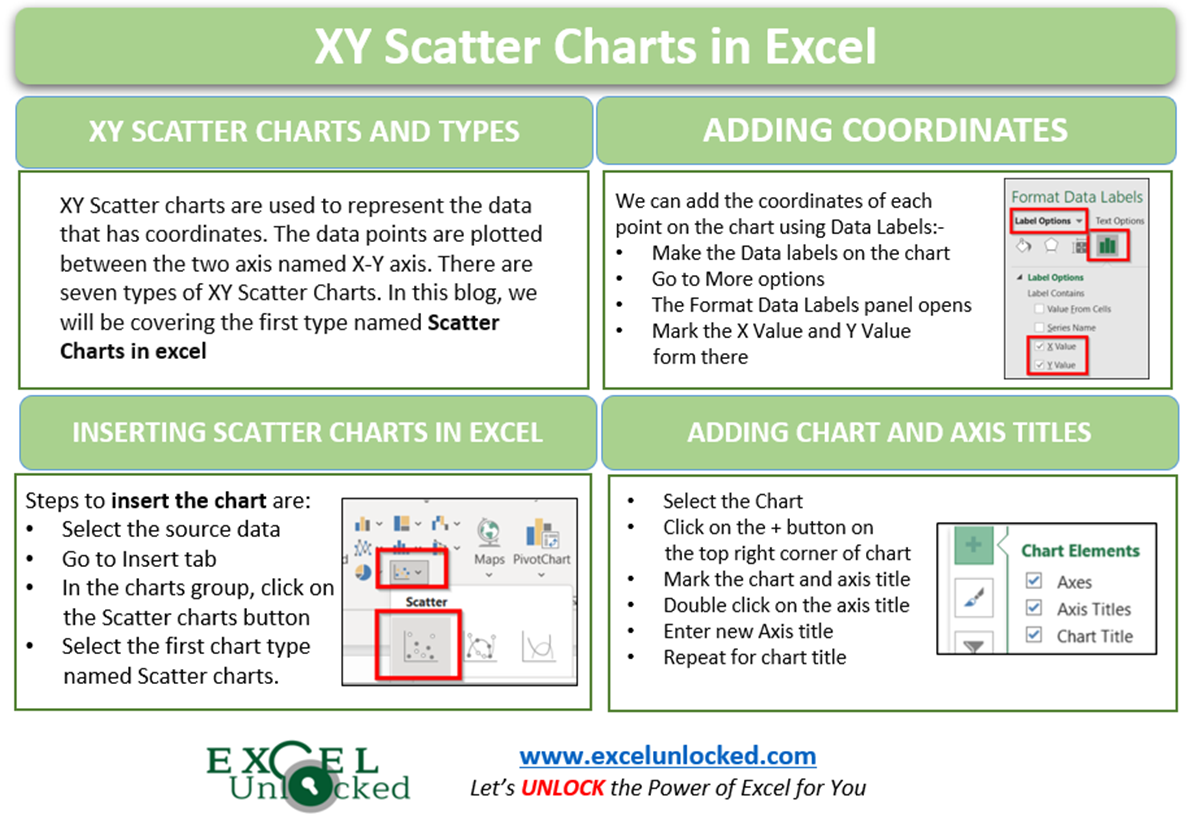
XY Scatter chart is a unique chart type that is used in special cases. Its usage is quite easy to understand. In this blog, we… Read Article
infographics complete guide on sparklines in excel

A Complete Guide on Sparklines in Excel

In our earlier blog, we learned the basics of Sparklines, including the definition, types, and insertion. In this blog, we will be covering the total… Read Article
infographics sparklines in excel

Sparklines in Excel – Types, Usage, Insertion

ln the earlier sections, we learned the usage of many types of charts in excel. Sparklines in Excel are also a type of visual representation… Read Article
infographics 100 % Stacked Area Chart in Excel

100% Stacked Area Chart in Excel – Insertion, Reading, Formatting

In the earlier blog, we learned the usage of 100 % Stacked Line Charts in Excel. It is recommended to first check the usage of… Read Article
infographics-changing-order-of-data-series-of-a-chart-in-excel-1

Change the Order of Data Series – Stacked Line, Stacked Area, Column Chart

Data Series is the part of the chart representing the source data visually. There are many common types of charts in Microsoft excel including Line… Read Article
Stacked Area Chart in Excel Infographics

Stacked Area Chart Excel – Usage, Insertion, Area vs Line, Negative Values

In one of our earlier blogs, we learned the usage of Area Charts in Excel. Stacked Area Chart in Excel covers one limitation of Area… Read Article
infographics Area Chart in Excel

Area Chart in Excel – Types, Inserting, Line vs Area, Correcting Chart

In one of our earlier blogs, we understood the usage of line charts in excel. In the line charts, the consecutive data points join to… Read Article
infographics Pie of Pie Chart in Excel

Pie of Pie Chart in Excel – Inserting, Customizing, Formatting

In the earlier blog, we learned the usage of a simple Pie chart in Excel. Pie of Pie Chart in Excel is a special case.… Read Article
infographics Pie Chart in Excel

Pie Chart in Excel – Inserting, Formatting, Filters, Data Labels

The Pie Chart in Excel is the most commonly used and simplest of the charts that are used in projects analysis. Let us think of… Read Article
infographics-100-Stacked-Column-Chart-in-Excel-7

100% Stacked Column Chart in Excel – Inserting, Usage, Reading

In our earlier blogs, we learned the usage of Stacked Column Charts. 100% Stacked Column Chart in Excel is its subset. The chart is useful… Read Article
infographics stacked column chart in excel

Stacked Column Chart in Excel – Usage, Examples, Format, Special Gridlines

A stacked Column Chart in Excel is a great idea to visually represent the grouped data. In the earlier blog, we learned the usage of… Read Article
infographics 100% Stacked Line Chart in Excel

100% Stacked Line Chart in Excel – Inserting, Analyzing

In one of our earlier blogs, we learned the usage of Stacked Line Charts in Excel. 100% Stacked Line Chart in Excel is quite similar… Read Article
Older posts
Newer posts
← Previous Page1 … Page4 Page5 Page6 Next →
Generic selectors
Exact matches only
Search in title
Search in content
Post Type Selectors

Recent Comments

  • Nilesh Patel on Excel DATEDIF Function – Find Difference Between Dates
  • daniel on Excel XNPV Function – NPV With Irregular Cash Flows
  • wout on How to Insert Picture or Image in Excel Comment

Archives

Categories

  • Charts (69)
  • Functions (281)
  • Tips and Tricks (73)
  • VBA and Macro (73)
  • Home
  • Privacy Policy
  • Terms of Use
  • About Us
  • Contact Us
  • Site Map
Copyright @ExcelUnlocked.com 2025