In the recent blogs, we did the usage of AVERAGE and STDEV.P Function in Excel. The parameters of NORM.DIST Function uses these two functions. Let us see how it works.
When to Use NORM.DIST Function in Excel?
NORM.DIST Function in Excel is used to get the value of Probability Density Function (PDF) or Cumulative Distribution Function with the help of the mean and standard deviation of a set of values.
To understand what Normal Distribution is, let us take an example. Let us say it takes an average of 10 minutes to complete a task and there is a standard deviation of 2 minutes. By using the Normal Distribution concept, we can get the percentage of time for which the time taken would lie between 9 minutes and 11 minutes.
Probability Density Function vs Cumulative Distribution Function
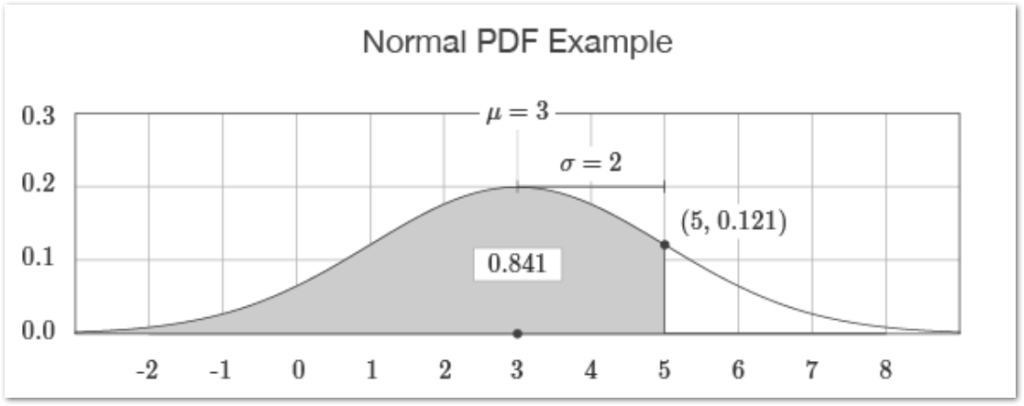
In the above figure:-
- μ – This is the mean of all values. 3 in this case
- σ – This represents the standard deviation, 2 in this case. In other words, we can say how to disperse the values from each other.
- X – The point on Horizontal Axis ( 5 ) is an independent variable for which we want to find the PDF or CDF
Here is the point on the curve (5,0.121) where the x coordinate is the independent variable x while the y coordinate is the value of the Probability Density Function. The area to the left of this point, under the curve ( highlighted ), is actually the value of the Cumulative Distribution Function.
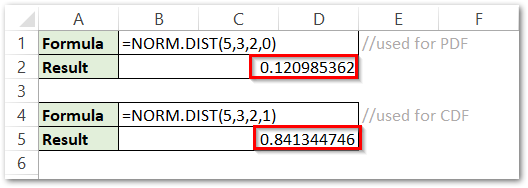
We can get those values by simply using the following formulas in excel.
Syntax and Arguments
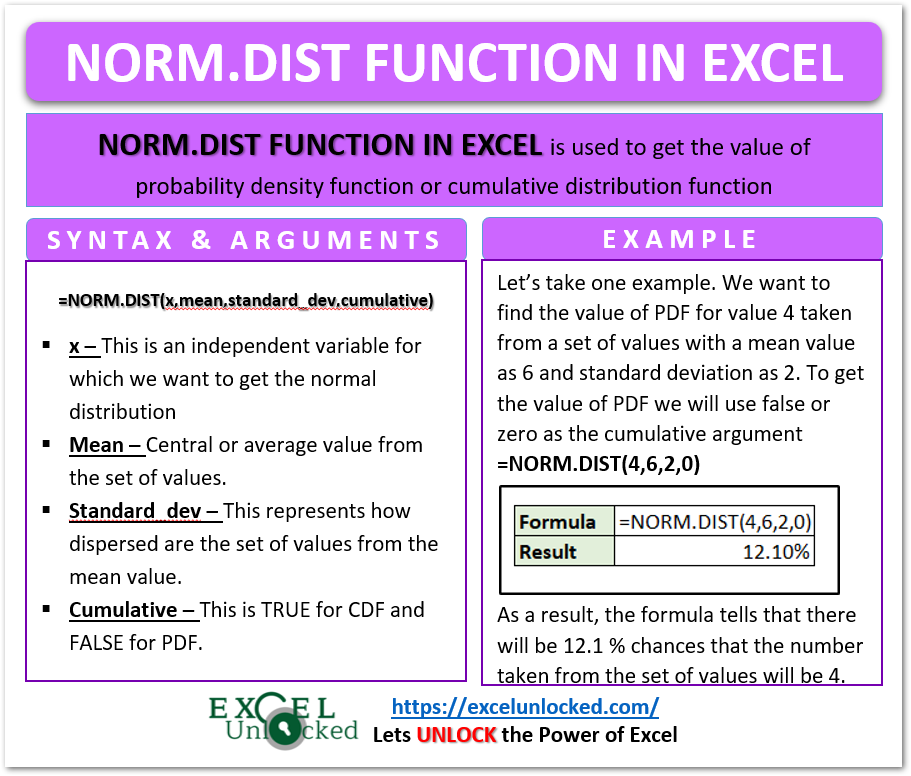
=NORM.DIST(x,mean,standard_dev,cumulative)
The following points will explain to you, the required function arguments for the NORM.DIST Function in Excel.
- x – This is an independent variable for which we want to get the Normal Distribution.
- mean – This is the central or average value in which x lies.
- standard_dev – This represents how dispersed is the set of values from the central (mean ) value.
- cumulative – This is a TRUE / FALSE value ( 1 or 0 ) which indicates whether we want to find CDF ( 1 ) or PDF (0).
Example for Using the NORM.DIST Function in Excel
Let us say we have the monthly sales of a company for a year as follows:-

We need to get the value of Mean and Standard Deviation so as use the NORM.DIST Function.
Use the Following mentioned formulas for AVERAGE and STDEV.P Function in Excel.
=AVERAGE(B2:B13)
=STDEV.P(B2:B13)
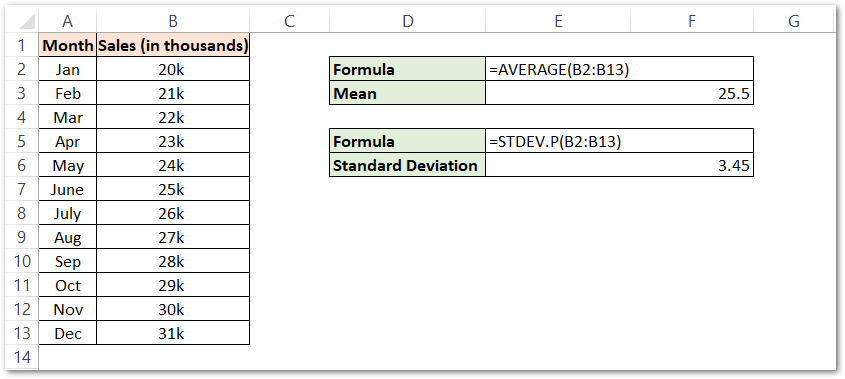
As a result, the formulas have returned the value of Mean value as 25.5 ( thousands ) and the Standard Deviation as 3.45
The mean value will act as the central tendency while the standard deviation tells how dispersed is this set of values from the mean central value.
Use the following formula to get the Probability Density Value for the sales of May.
=NORM.DIST(B6,E3,E6,FALSE)
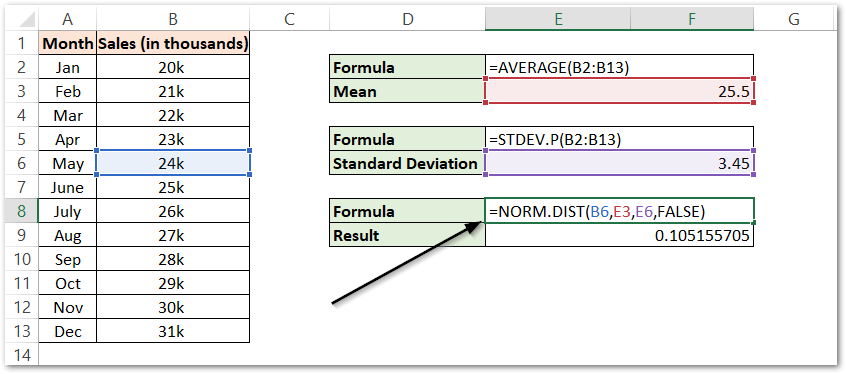
Explanation – We have passed the value of independent variable x as the sales of May referenced by cell B6. The second and third argument asks for the value of Mean ( E3 ) and Standard Deviation ( E6 ). We passed the Cumulative argument to be FALSE which will let the function return the value of Probability Distribution.
As a result, the formula returns 0.105. This implies that probably sales occurring to be 24k ( sales of May ) in the set of monthly sales if 10.5 %.
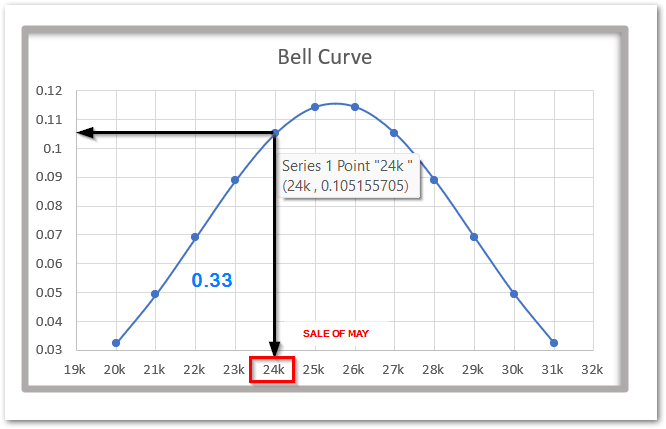
The above Bell Curve clearly explains the concept.
Similarly, we can use the NORM.DIST Function to get the value of the area to the left of this point (24k,0.105) under the curve ( Cumulative Distribution ).
We will apply the same formula we used to get the value of Probability Density, we just need to take a TRUE as the cumulative argument.

This tells us that 33% of the area under the curve lies for the values less than 24k.
With this, we have come to the end of the blog. Thank you for reading.
RELATED POSTS
- STDEV.S Function in Excel – Sample Standard Deviation
- VAR.P Function in Excel – A Statistical Function
- CHISQ.DIST Function in Excel – Chi-Square Distribution
- BETA.DIST Function in Excel – A Statistical Function
- VAR.S Function in Excel – Variance of Sample
- CHISQ.DIST.RT Function in Excel – Statistical Formula
