In the previous blogs, we implemented the NORM.DIST and BINOM.DIST Function. In this blog, we would learn another type of distribution with the help of CHISQ.DIST Function in Excel.
So let us begin learning.
When to Use CHISQ.DIST Function in Excel?
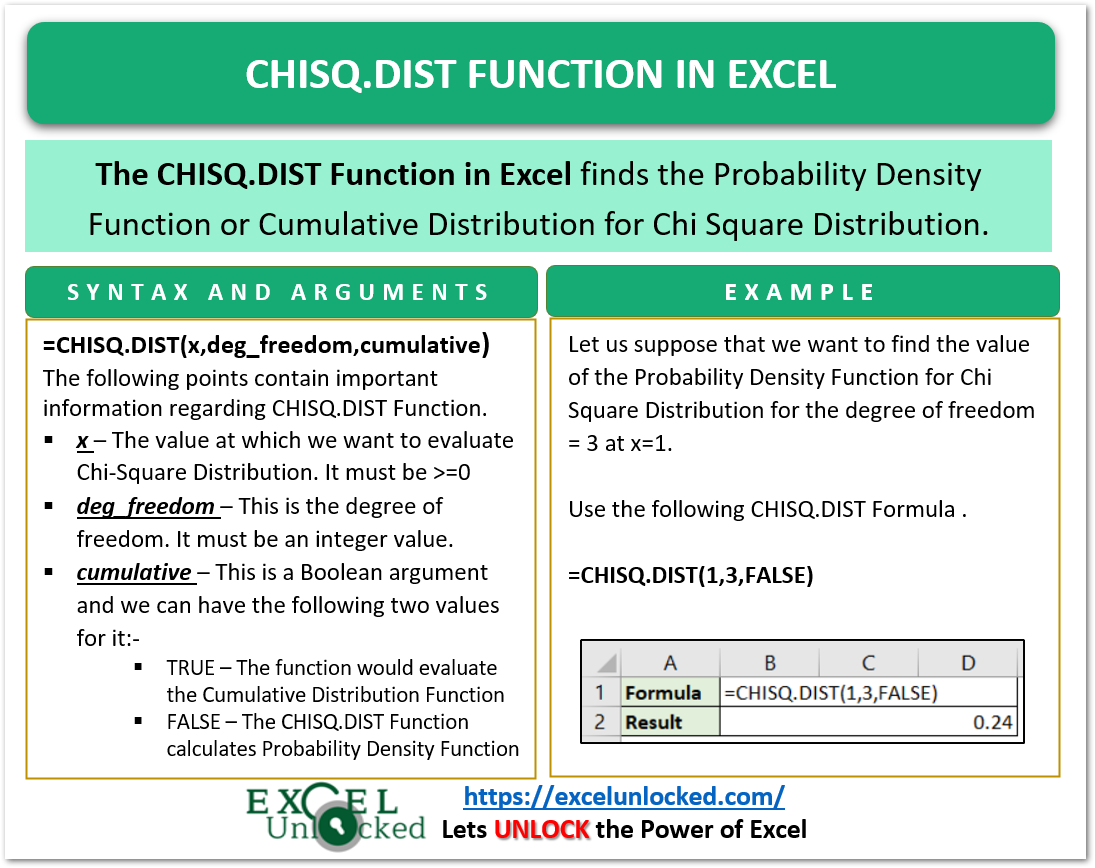
The word CHISQ.DIST represents Chi-Square Distribution. The CHISQ.DIST function can find the Probability Density Function as well as the Cumulative Distribution for Chi Square Distribution.
The Function can find PDF or CDF of Chi Square Distribution for k degrees of freedom at a given value.
The Function is an important Statistical Function and was introduced in Excel 2010. It cannot be used in Excel 2007 or earlier versions.
Syntax and Arguments
=CHISQ.DIST(x,deg_freedom,cumulative)
The following points contain important notes to understand what type of inputs are required by the CHISQ.DIST Function.
- x – The value at which we want to evaluate Chi-Square Distribution. It must be >=0
- deg_freedom – This is the degree of freedom. It must be an integer value from 1 to 1010.
- cumulative – This is a boolean argument and we can have the following two values for it:-
- TRUE – The function would evaluate the Cumulative Distribution Function. The function returns left tailed probability when the cumulative argument is TRUE
- FALSE – The CHISQ.DIST Function calculates Probability Density Function

Important Notes about CHISQ.DIST Formula
Before you start implementing the CHISQ.DIST Formula, we have got some important points to cover.
- The Function cannot be used in Excel 2007 or earlier versions.
- If the deg_freedom argument is nonintegral, then the value after the decimal points would be truncated.
- When we plot the graph for PDF or CDF, then the shape of the curve would be defined by the value of the degree of freedom.
- The CHISQ.DIST Function returns a #NUM! error when:-
- The value of x is less than zero.
- The value of the degree of freedom argument is >=1 and <= 1010
Example to Learn CHISQ.DIST Function
In this section, we would implement the CHISQ.DIST Formula.
Example 1 – Finding Probability Density Function for Chi Square Distribution
The Probability Density Function graph for Chi Square Distribution at the degree of freedom as 1,2 and 3 is given as:-

As the value of the degree of freedom increases, the curve shifts to the right of the graph.
Let us suppose that we want to find the value of the Probability Density Function for Chi Square Distribution for the degree of freedom = 3 at x=1. Use the following CHISQ.DIST Formula.
=CHISQ.DIST(1,3,FALSE)

As a result, the function returns the result as 0.24 which can also be verified from the graph.
Explanation – We have supplied the value of x as 1 and deg_freedom as 3. The Cumulative Argument is FALSE as we needed the value of the Probability Density Function.
Example 2 – Getting Cumulative Density Function for Chi-Square Distribution
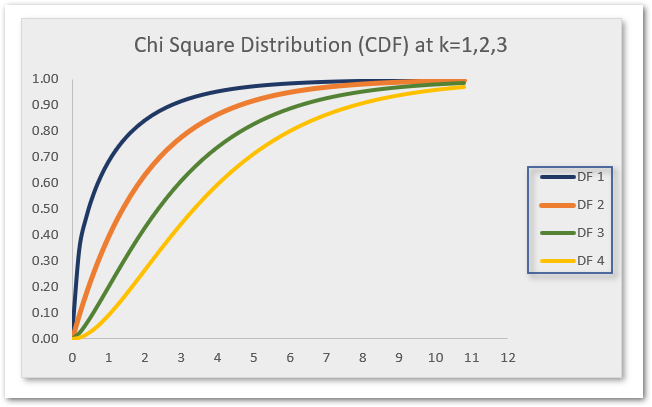
Here we have the Cumulative Distribution Graph of Chi-Square Distribution at degrees of freedom 1,2,3 and 4 as follows.

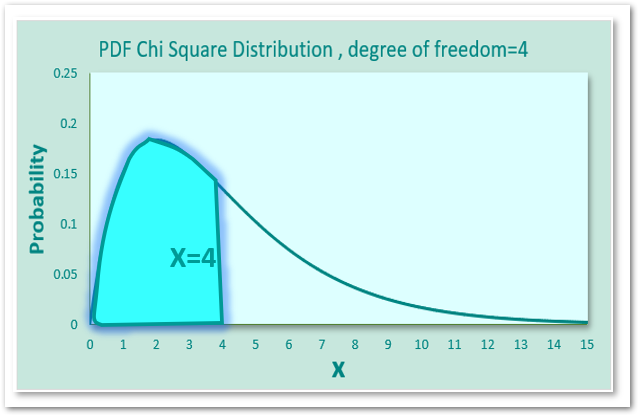
Let us suppose we want to find the value of Cumulative Distribution at x=4 when degrees of freedom is 4. We would get the sum of probabilities from the extreme left of the Probability Distribution Function to the specified value of x.
Use the following CHISQ.DIST Function Formula.
=CHISQ.DIST(4,4,TRUE)

As a result, we get the value of the cumulative distribution function as 0.59. This is the left tailed probability at x=4 when we have a degree of freedom =4.
Explanation – We have passed the value of x and deg_freedom argument as 4 and 4 respectively. Since we wanted the result for cumulative distribution, we passed the value of the cumulative argument as TRUE. Here we got the value of left tailed probability for x=4 as shown below.

This brings us to the end of CHISQ.DIST Function blog.
Thank you for reading.
RELATED POSTS
- BETA.DIST Function in Excel – A Statistical Function
- BINOM.INV Function in Excel – Inverse Cumulative Distribution
- NORM.DIST Function in Excel – Get PDF and CDF
- BINOM.DIST.RANGE Function in Excel
- BINOM.DIST function in Excel – Probability of N Successes
- FREQUENCY Function in Excel – Statistical Function
