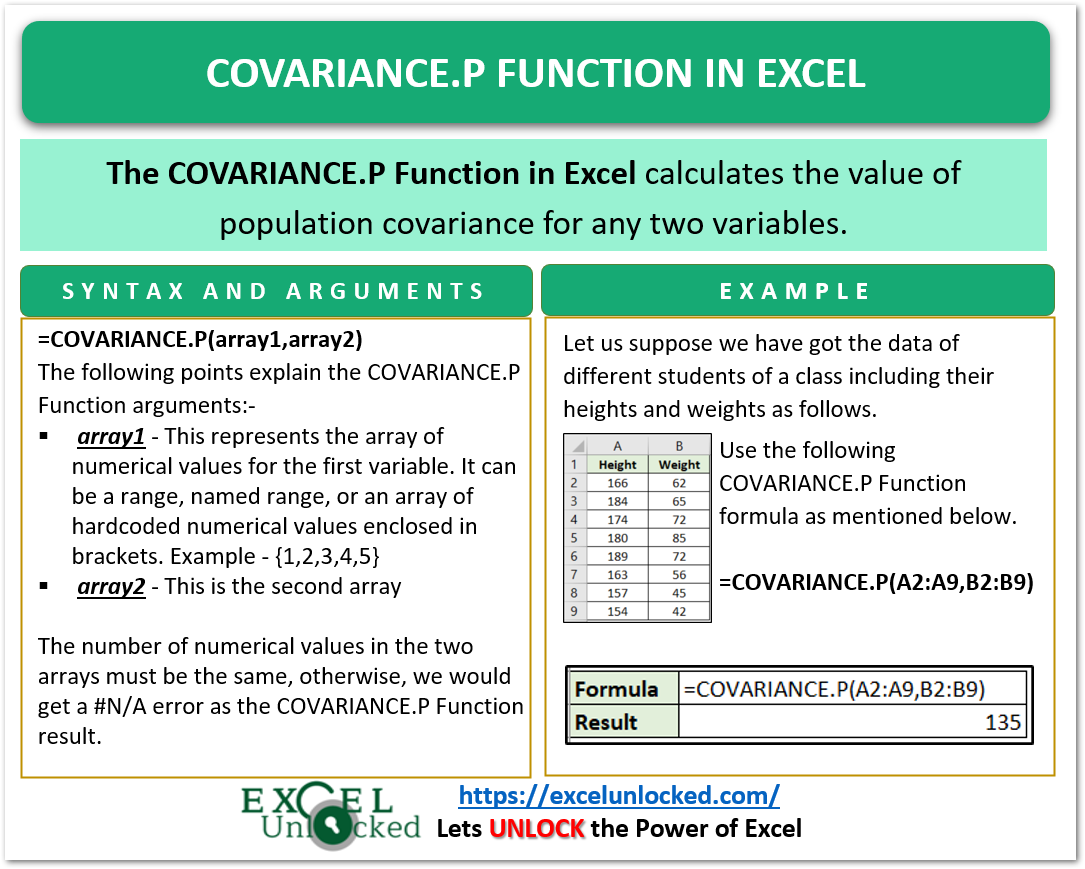
In the previous blog, we implemented the COVARIANCE.S Function. In this article, we are going to implement another interesting and useful function which is COVARIANCE.P Function in Excel.
So let us start learning the COVARIANCE.P Function.
When to Use COVARIANCE.P Function?
The word “COVARIANCE.P” represents Covariance of Population. The COVARIANCE.P Function in Excel calculates the value of Population Covariance between two data sets.
Population Covariance refers to the average product of deviations of each data point pair from the mean value of both of the data sets.
COVARIANCE.P Function was introduced in Excel 2010 and is a type of Statistical Function.
What is Population Covariance?
The value of Covariance tells the relationship between two variables. You can check the two types of Covariance from here.
Let us suppose we have two random variables X and Y. The general formula used by COVARIANCE.P Function to get the Population Covariance is:-

n = number of elements in each of both data sets X and Y
i = The value of i goes from 1 to n
Xi – since i starts from 1 to n, Xi represents all the data elements X1, X2, X3 up to Xn
Yi – This represents all the data elements Y1, Y2, Y3 up to Yn
μx – is the population mean of all the values contained in X
μy – is the population mean of all the values contained in Y
Therefore, ( Xi – μx) represents the deviation of all the values in X from the average value μx.
( Yi – μy) represents the deviation of all the values in Y from the average value μy
Covariance refers to the average of sum of product of all the corresponding deviations of data points in X and Y. COVARIANCE.P Function does all the mathematical calculations in one go.

Syntax and Arguments
=COVARIANCE.P(array1,array2)
The following points have information regarding the inputs required by the COVARIANCE.P Function in Excel.
- array1 – This is a range of values contained in the first random variable X of the formula.
- array2 – This is the second array inputting the values of the second random variable Y. The number of elements of both arrays must be equal.
Essential Points about COVARIANCE.P Function
We have some important points to know about before you start implementing the formula.
- The COVARIANCE.P Function was introduced in Excel 2010. You can use COVAR Function for Excel 2007 or earlier versions of Excel
- The inputs of the function can be a range of values as a reference, a named range, or hardcoded numbers enclosed in brackets like this: {1,2,3,4,5,6}
- When the size of both arrays is not the same, we get a #N/A error as the function result.
- The function ignores those cells that do not contain numerical data.
- The data sets should not be empty and the standard deviation of their values should not be equal to zero.
Example to Implement COVARIANCE.P Function
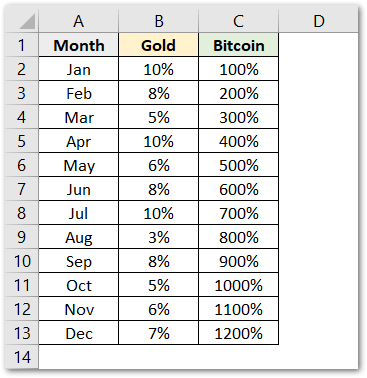
Let us suppose we have the monthly returns of two assets gold and bitcoin.

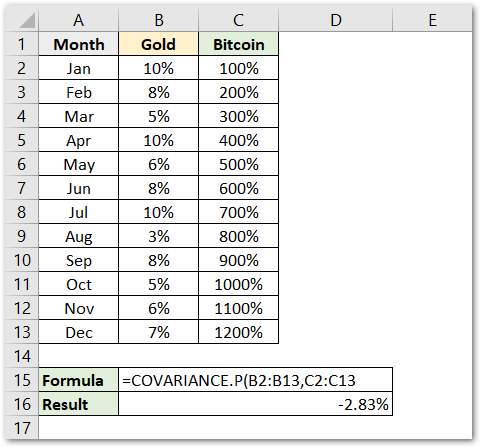
We would now try to find out the relationship between two variables by finding the value of covariance between two variables. We would use the following COVARIANCE.P Function in Excel to find the covariance of data in columns B and C.
=COVARIANCE.P(B2:B13,C2:C13

As a result, we get a negative covariance of -2.83 as the function result.
Explanation – We have supplied the values of the variables Gold and Bitcoin monthly returns as the array1 and array2 arguments. As a result, the function calculates the value of population covariance.
This brings us to the end of COVARIANCE.P Function.
Thank you for reading.
