The COVARIANCE.S Function is an important Staticlal Function of Excel. It is easy to learn as well as implement. The Function has a very good usage in Statistics as well as in Finance.
So let us start learning.
When to Use COVARIANCE.S Function in Excel
The COVARIANCE.S function calculates the value of sample covariance for any two variables. Covariance defines the relationship between two variables. If there exists a relation between two variables, then Covariance determines how the change in one variable affects the other variable and to what extent.
The COVARIANCE.S Function was introduced in Excel 2010. It cannot be used in earlier versions.
General Formula of Covariance
Let us suppose we have two variables x and y. We got a set containing an equal number of values in for both data sets. We would assume the total number of different values of both x and y is N each. The formula to calculate sample covariance between the two variables is:-

Σ represents submission where i start from 1 to N and xi go from x1, x2, x3 up to xN
yi go from y1, y2, y3 up to yN
x̄ and ȳ represent the mean of values of variables x and y.
Types of Covariance
There are namely two kinds of covariance that can possibly exist between any two variables.
- Positive Covariance – If the increase in the value of one variable leads to an increase in the value of another variable and vice versa then there would be positive covariance. An example is the Height and Weight relationship where an increase in one leads to an increase in another ( during the growth years of a person)
- Negative Covariance – When the increase in the value of one variable leads to a decrease in the value of another variable and vice versa then we have negative covariance. We can think of Height above sea level and Temperature where an increase in one leads to a decrease in another and vice versa.
Syntax and Arguments
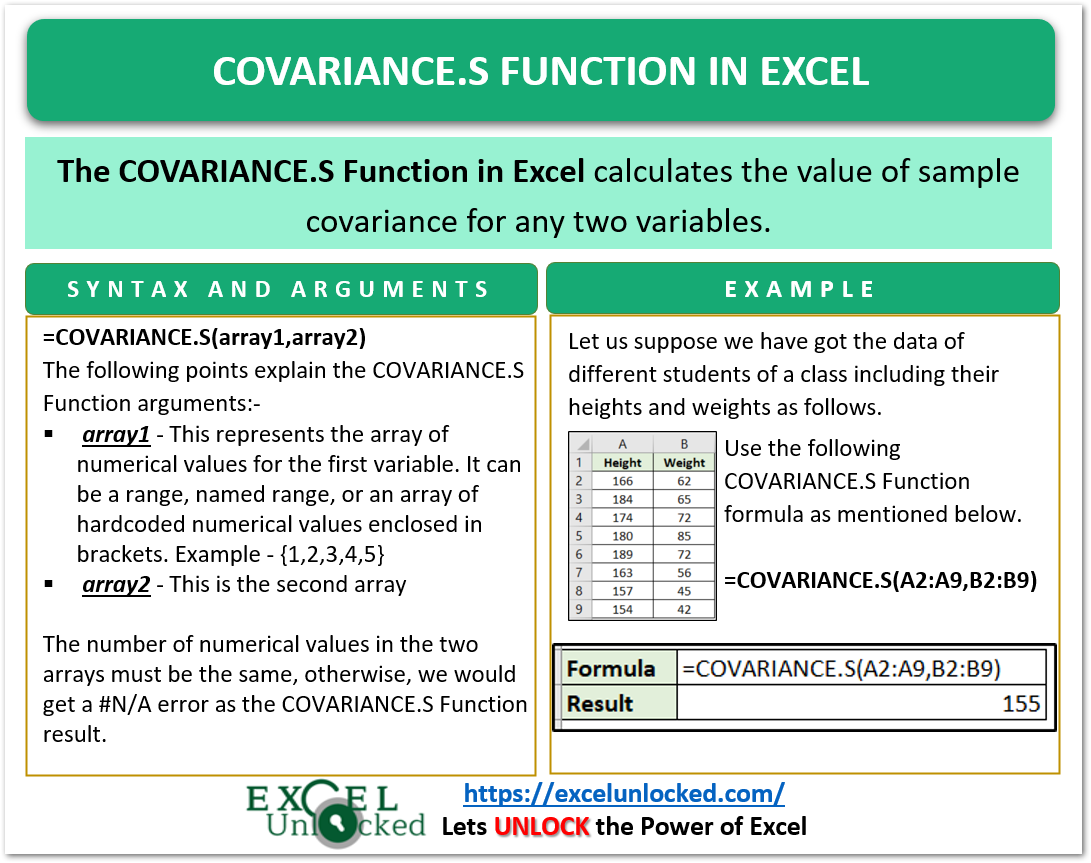
=COVARIANCE.S(array1,array2)
Here we got the list of inputs required by COVARIANCE.S Function in Excel.
- array1 – This represents the array of numerical values for the first variable. It can be a range, named range, or an array of hardcoded numerical values enclosed in brackets i.e {1,2,3,4,5}
- array2 – This is the second array whose size must be equal to array1 or else we would get a #N/A error
Important Notes about COVARIANCE.S Function
In this section of the blog, we are sharing some important points regarding COVARIANCE.S Function in excel.
- The total number of elements in each variable must be greater than one. The COVARIANCE.S Function gives a #DIV/0! error when N=1.
- When the number of values in two variables is not the same, we get a #N/A error.
- When the reference to the array is supplied as array1or array2 argument, then the function ignores the text string, logical values (TRUE and FALSE), and cells containing error messages.
- The COVARIANCE.S Function calculates sample covariance, for population covariance you can use COVARIANCE.P Function
Examples for COVARIANCE.S Function in Excel
We would now perform some experimentation with the COVARIANCE.S function.
Example 1 – Positive Covariance between Height and Weight
Let us suppose we have the records of height and weight of different students of a class as follows.
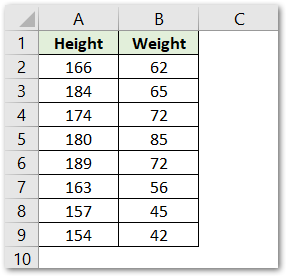
Use the following COVARIANCE.S Formula to get the covariance between two arrays Height and Weight.
=COVARIANCE.S(A2:A9,B2:B9)
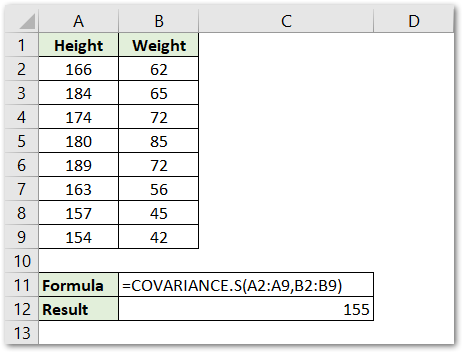
We have supplied the array1 and array2 argument as the range A2:A9 and B2:B9 as it contained height and weight. As a result, we got a positive sample covariance of 155 between the two variables.
Example 2 – Negative Covariance between Two Variables
Let us suppose we have different values of Height above Sea Level and Temperature.
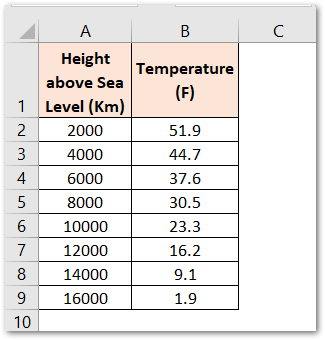
Use the following formula for finding sample covariance between the two data sets A2:A9 and B2:B9.
=COVARIANCE.S(A2:A9,B2:B9)
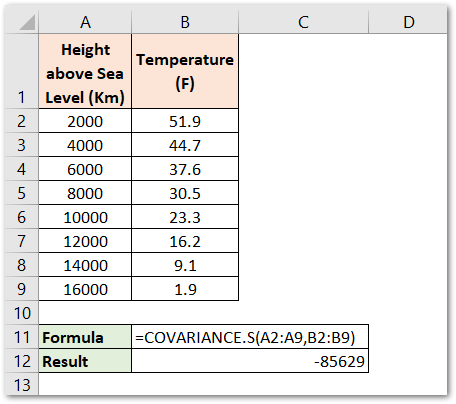
As a result, we got a negative covariance of -85629.
This brings us to the end of COVARIANCE.S Function blog
Thank you for reading
