In the previous article, we implemented the BINOM.DIST Function. In this blog, we would learn the usage of another essential function – BINOM.INV Function in Excel.
So let us begin.
When to Use BINOM.INV Function in Excel?
The BINOM.INV calculates the Inverse of Cumulative Distribution. The BINOM.INV Function tells the minimum number of successes x required to happen out of n trials for a given value of cumulative probability distribution. The value of cumulative probability is called the criterion value
The BINOM.INV Function is an important type of Statistical Formula of Excel. It can be used as CRITBINOM Function in Excel 2007 or earlier versions of Excel.
Syntax and Arguments
=BINOM.INV(trials,probability_s,alpha)
The following points contain notes about inputs required by the BINOM.INV Function in Excel.
- trials – This is the total number of times the experiment is repeated.
- probability_s – This is the probability of success in each experiment.
- alpha – This is the value of cumulative distribution for which we want to know the maximum value of the number of successes out of n trials. It lies in the range [0,1]
Cumulative Probability Distribution Graph
We would now understand the meaning of Cumulative Probability Distribution.
Let us suppose you have three coins and you tossed them in one go. What can be the possible outcomes upon tossing three coins?
| Coin 1 | Coin 2 | Coin 3 | Number of Heads |
| Head | Head | Head | 3 |
| Head | Head | Tail | 2 |
| Head | Tail | Head | 2 |
| Tail | Head | Head | 2 |
| Head | Tail | Tail | 1 |
| Tail | Head | Tail | 1 |
| Tail | Tail | Head | 1 |
| Tail | Tail | Tail | 0 |
Let us suppose getting a head is a success. There can be either 0 head, 1 head, 2 heads, or 3 heads when you tossed three coins.
Let us plot a cumulative probability distribution for zero heads, at most 1 head, at most 2 heads, and at most 3 heads with the use of BINOM.DIST Formula.
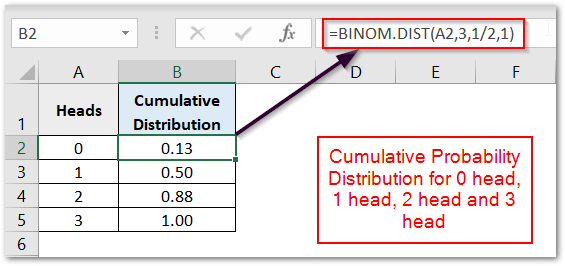
We have used the following formula in cell B2 and copied it down.
=BINOM.DIST(A2,3,1/2,1)
What does BINOM.INV result Tells?
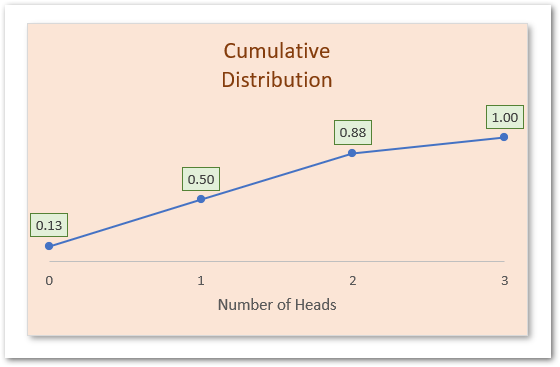
This graph has the following insights:-
- The probability of getting zero heads is 0.13 ( 1/8 ). This is the case of getting (TTT(0)). In the bracket, we got the number of heads.
- The probability of getting a maximum of 1 head ( zero head or 1 head ) is 0.50. The cases of getting at most 1 head when tossing three coins are – (TTT (0), TTH(1), THT(1), HTT(1)). Thus the probability becomes 4/8. This includes the zero head probability which is 0.13 or 1/8.
- We have the probability of getting a maximum of two heads as 0.88 ( 7/8 ). This includes either getting 0 head (TTT(0)), 1 head (HTT,THT,TTH) or 2 head (HHT.HTH,THH). Therefore It becomes 7/8
- The fourth case is the probability of getting at most 3 heads which is a sure event as we tossed three coins. So its cumulative probability becomes 1.
The BINOM.INV Function can tell the maximum number of heads we can get when we toss a coin three times and when the value of cumulative probability is 7/8 or 0.88.

Here 3 is the total number of times we toss the coin. 0.5 is the probability of getting a head upon tossing the coin. 7/8 is the value of cumulative probability. We get the result as 2 which can be verified by the graph.
Also Read: BINOM.DIST.RANGE Function in Excel
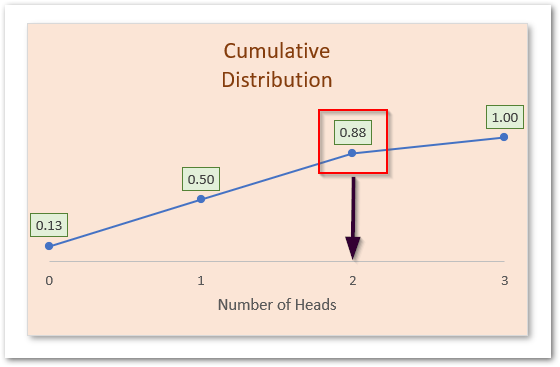
In other words, we can say that the probability of getting at least 2 heads would be greater than 0.88 or 88%. So the function tells the minimum value of a number of successes required for a cumulative value greater than or equal to the criterion value.

Example for BINOM.INV Function in Excel
In this section of the blog, we would implement the BINOM.INV Function through an example.
Let us suppose we got the following values for the number of independent trials, probability of successes, and criterion value.
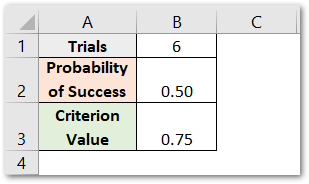
We would now find the minimum value of success to produce a cumulative distribution greater than or equal to a criterion value of 0.75
=BINOM.INV(B1,B2,B3)
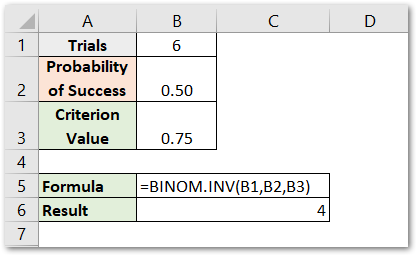
Therefore, a minimum of four successes are required to produce a cumulative distribution equal to or greater than the criterion value.
This brings us to an end.
Thank you for coming.
RELATED POSTS
- CHISQ.DIST Function in Excel – Chi-Square Distribution
- CHISQ.INV Function in Excel – Inverse Chi Square Distribution
- BETA.DIST Function in Excel – A Statistical Function
- CHISQ.DIST.RT Function in Excel – Statistical Formula
- PERCENTILE.INC Function in Excel – Inclusive Function
- NORM.DIST Function in Excel – Get PDF and CDF
