In one of the earlier blogs, we covered the usage of NORM.DIST function. In this blog, we would implement a very flexible Statistical Function – BETA.DIST Function in Excel.
So let us start learning.
When to Use BETA.DIST Function in Excel?
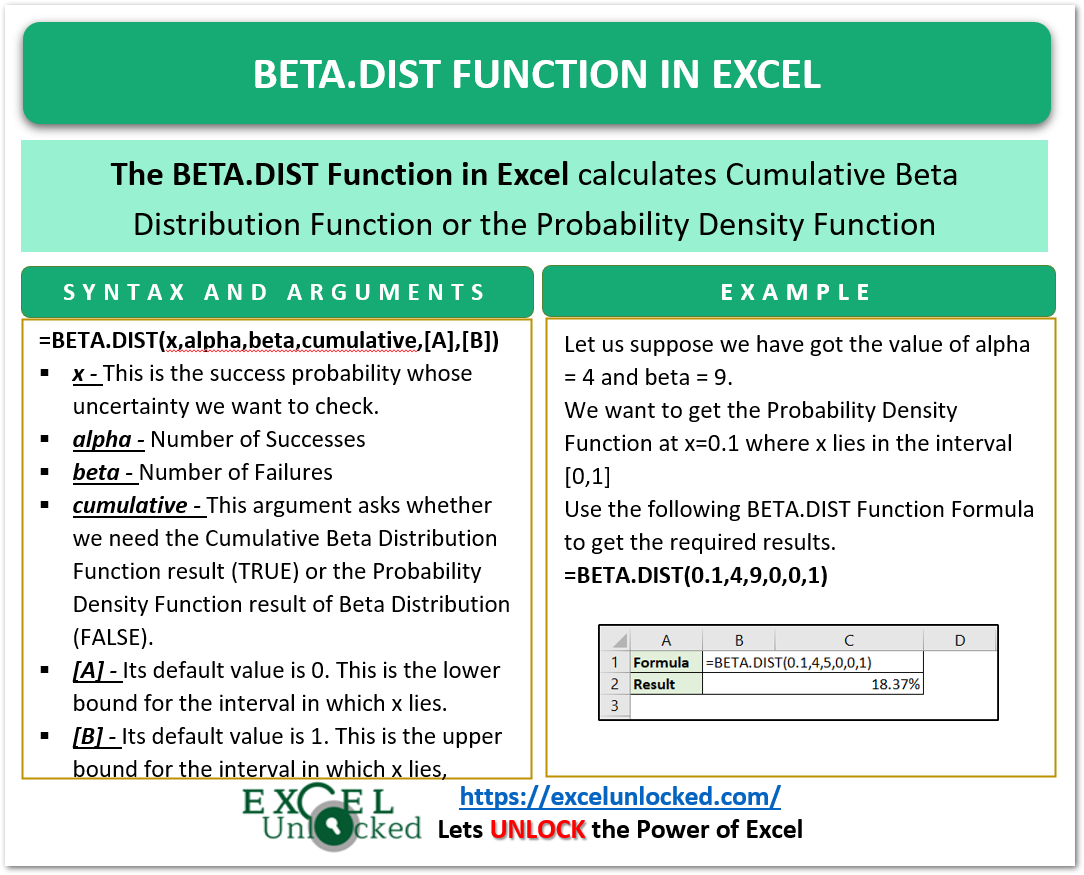
The BETA.DIST function calculates the value of the Cumulative Beta Distribution Function or the Probability Density Function of the Beta Distribution for a specific set of parameters.
The BETA.DIST Function was introduced in Excel 2010 and cannot be used in earlier versions of Excel. You can use BETADIST Function for earlier versions.
Why We Calculate Beta Distribution?
Beta Distribution is a type of Probability Distribution. It requires a couple of parameters. It is used to predict the uncertainty about the probability of success of an experiment.
Let us suppose the probability of success of an experiment is x. Consequently, the probability of failure would be 1-x.
We know that the probability of success, x lies in the interval [0,1]
We want to check the uncertainty in the x. Let us assume that we performed n trials of this experiment out of which we got k successes. Therefore the number of failures from n trials would be n-k.
Now we want to revise the x based on the number of experiments we conducted ourselves. We want to get the conditional distribution of x, based on the number of successes and failures through trials of the experiment we conducted n times. The result of this Distribution is Beta Distribution.
Here we would need three parameters
- x – which is the initial probability of success lying in the interval [0,1].
- alpha = k+1 which is the total number of successes we observed when we conducted n trials of the experiment.
- beta = (n – k), which is the number of failures in the n trials.
Syntax and Arguments
=BETA.DIST(x,alpha,beta,cumulative,[A],[B])
Here we have explained the inputs required by BETA.DIST function in Excel.
- x – This is the success probability whose uncertainty we want to check.
- alpha – Number of Successes ( decides the shape of the distribution curve )
- beta – Number of Failures ( decides the shape of distribution curve )
- cumulative – This argument asks whether we need the Cumulative Beta Distribution Function result (TRUE) or the Probability Density Function result of Beta Distribution (FALSE).
- [A] – Its default value is 0. This is the lower bound for the interval in which x lies.
- [B] – Its default value is 1. This is the upper bound for the interval in which x lies,

Graphical Presentation of Beta Distribution
In this section of the blog, we would try to understand the implementation of BETA.DIST function with examples.
Example 1 – Probability Density Function of Beta Distribution
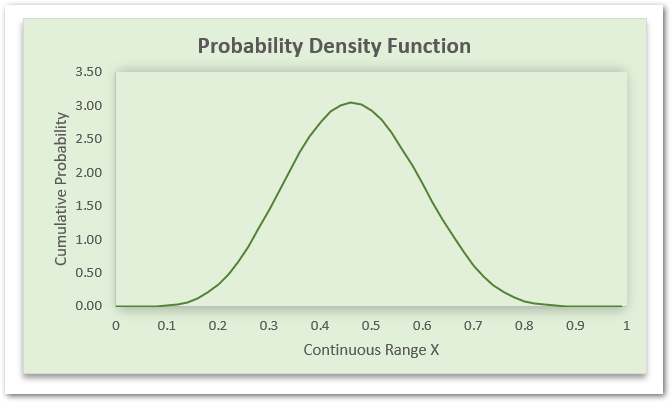
Here, let us suppose we conducted 15 trials of the experiment out of which we got 7 successes ( alpha) and 8 failures (beta). Using this experiment result, we want to predict the uncertainty of the claimed probability of success.

Here, we plotted a curve of Probability Density Function for all possible values of x ( probability of success ) lying in the interval [0,1]. The area under the is always curve = 1.
With the use of BETA.DIST Function, we can get the value of Probability Density Function at any value of x from the range [0,1], using this formula:
=BETA.DIST(x,7,8,FALSE)
Example 2 – Cumulative Beta Distribution
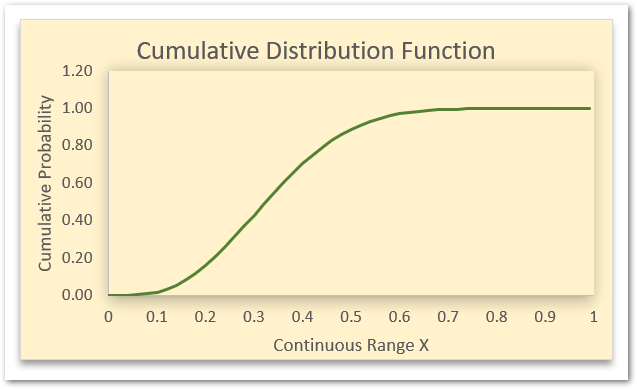
In this example, let us suppose we have the cumulative beta distribution with alpha ( number of successes) and beta (number of failures ) set to 4 and 8 respectively.

Here we have got the graph of the Cumulative Distribution Function with alpha = 4 and beta = 8. The interval of x is [0,1] as seen on x-axis. On the y-axis, we got the value of the Cumulative Beta Distribution Function.
With the use of BETA.DIST Function, we can get the value of Cumulative Beta Distribution Function at any value of x from the range [0,1], using this formula:
=BETA.DIST(x,4,8,TRUE)
Where x lies in the continuous range [0,1] and TRUE implies Cumulative Beta Distribution.
This brings us to the end of BETA.DIST Function blog.
Thank you for reading.
RELATED POSTS
- BINOM.DIST.RANGE Function in Excel
- BINOM.DIST function in Excel – Probability of N Successes
- BINOM.INV Function in Excel – Inverse Cumulative Distribution
- CHISQ.DIST.RT Function in Excel – Statistical Formula
- CHISQ.INV Function in Excel – Inverse Chi Square Distribution
- VAR.S Function in Excel – Variance of Sample
