The CORREL Function in Excel is an essential type of Statistical Function. The CORREL Function is very easy to use and is one of the crucial functions in checking the relationship between two events.
Let us see how the CORREL Function works.
When to Use CORREL Function in Excel?
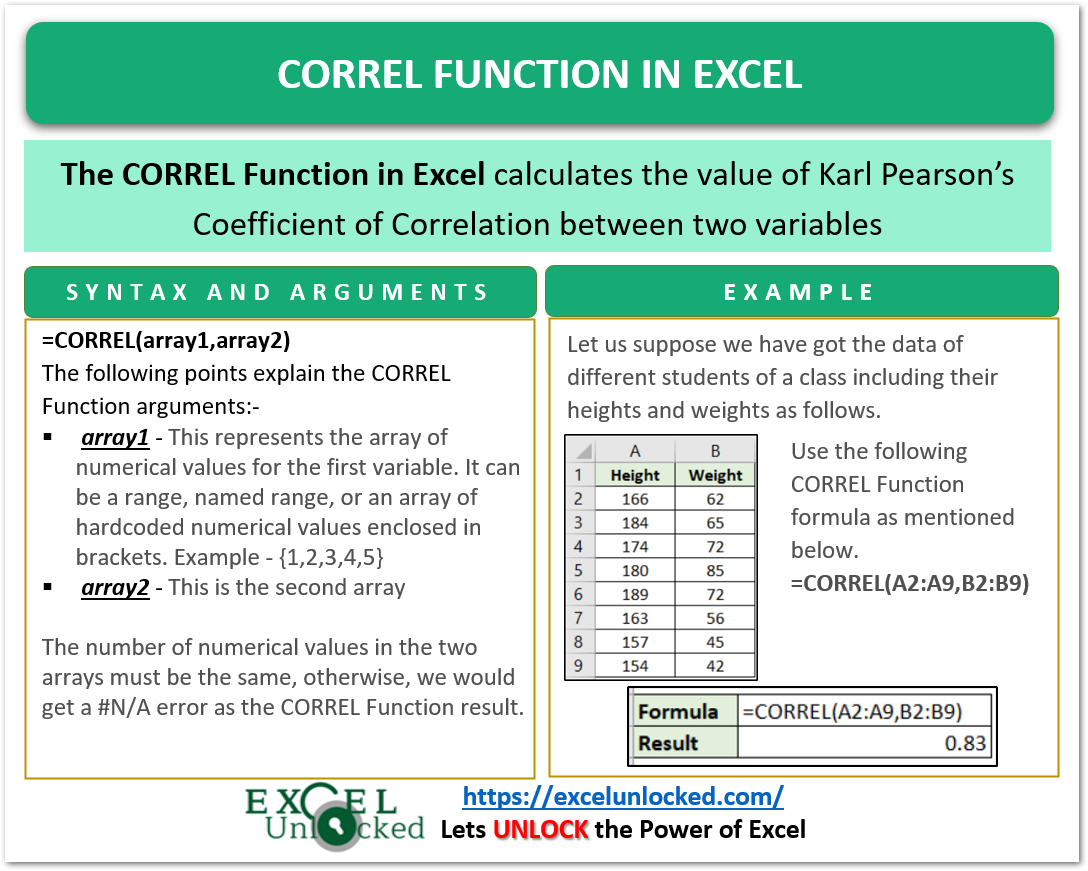
The word CORREL represents Correlation. The CORREL Function in Excel finds the value of Karl Pearson’s Coefficient of Correlation. This method tells the relationship between two events and to what extent the events are affected by each other.
The Coefficient of Correlation is obtained by the division of the value of Convairance with the Product of the Standard Deviation of two arrays.
Syntax and Arguments
=CORREL(array1,array2)
The following points contain required information regarding the inputs to supply to the CORREL Function.
- array1 – This represents the array of numerical values for the first variable. It can be a range, named range, or an array of hardcoded numerical values enclosed in brackets i.e {1,2,3,4,5}
- array2 – This is the second array
What to Infer from CORREL Function Result?
The CORREL Function tells the value of the Coefficient of Correlation between two arrays of numerical values. The formula to calculate the Coefficient of Correlation is as follows:-
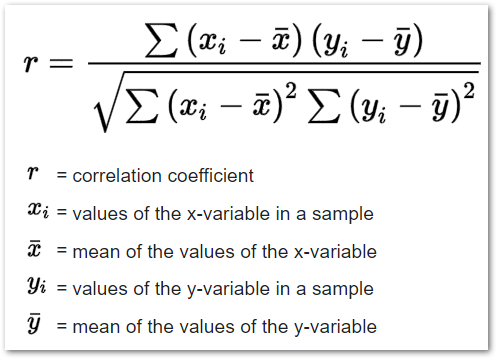
Where x and y are two arrays between which want to find the relationship.
The value of the Coefficient of Correlation indicates the following results.
- The CORREL Function result can be from -1 to +1
- For +1 correlation value, indicates a perfect positive correlation respectively. A positive correlation indicates that an increase in the values of one array leads to an increase in values of the other event and vice versa.
- A value of -1 indicates a perfect negative correlation. In a negative correlation, the increase in values of one variable leads to a decrease in values of other variables and vice versa.
- If the value of correlation is zero or near zero, then it indicates zero correlation between two variables.
Important Points About CORREL Function
Here we have covered some important points regarding the CORREL Function of Excel.
- The Standard Deviation of any of the two variables cannot be zero. We will get a #DIV/0 error if the Standard Deviation is zero for any of the two variables. This is so because when the function calculates the Correlation Coefficient, it takes the product of the Standard Deviation of two variables as the denominator.
- The number of numerical values in the two arrays must be the same, otherwise, we would get a #N/A error as the CORREL Function result.
- If the array contains any logical value, text string, or an empty cell, then the CORREL Function simply ignores it. However, the cells containing zeroes are included in the array.
Example to Implement the CORREL Function
In this section of the blog, we are going to implement the CORREL function examples.
Example 1 – Relation Between Height and Weight of Different Students
Let us suppose we have got the data of different students of a class including their heights and weights as follows.
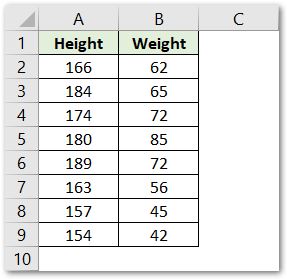
Use the following CORREL Function formula as mentioned below.
=CORREL(A2:A9,B2:B9)
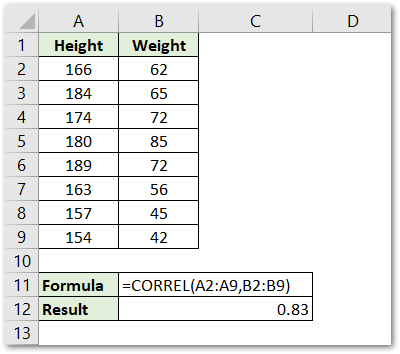
As a result, we get the value of Correlation Coefficient as 0.83 which indicates to the fact that there is a high degree positive correlation between weight and height.
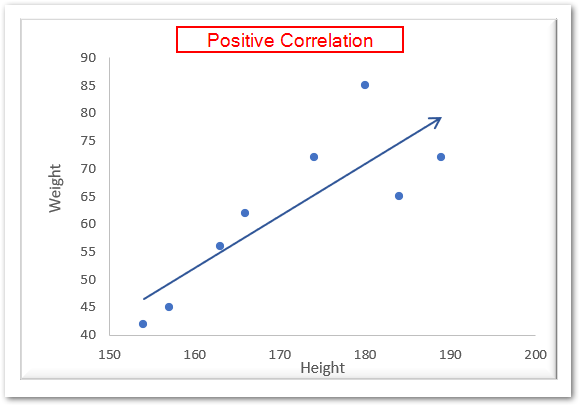
Explanation – We have supplied the values of weight and height array as range A2:A9 and B2:B9 to the array1 and array2 argument of CORREL Function Formula. Thereafter, the function calculates the value of Correlation Coefficient.
Example 2 – Relation Between Height above Sea Level and Temperature
Let us suppose we have got the different values for Height above Sea Level in Km and the Corresponding Temperature at that height.
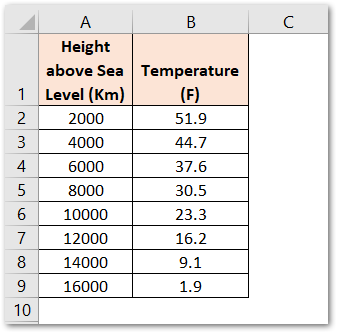
It is logical to understand the fact that when the height above sea level increases, the temperature drops accordingly.
We would now find the relationship between the two variables, height and temperature. Use the following CORREL Function Formula.
=CORREL(A2:A9,B2:B9)
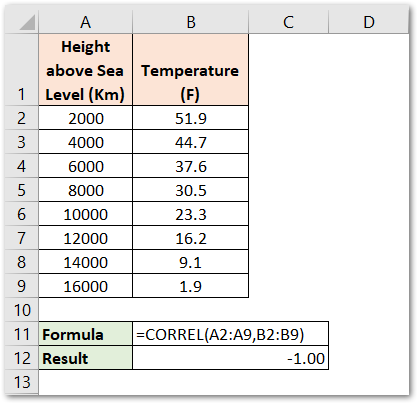
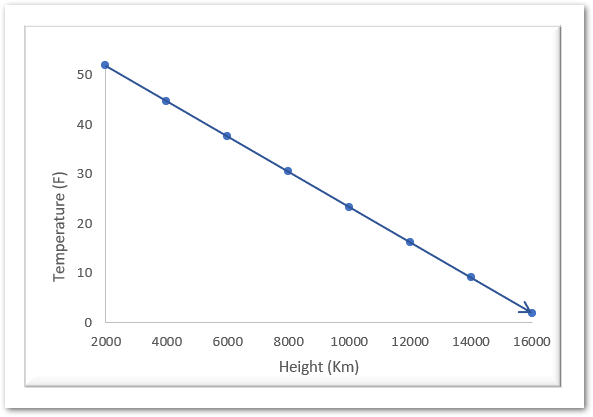
As a result, we find the value of Correlation Coefficient as -1.00. This is a perfectly negative correlation.
Explantion – There exists an inverse or negative correlation between the two variables, -1.00 indicates that the when one variable goes up ( Height above Sea Level ), the other variable goes down ( Temperature ) to an equal extent each time.
This brings us to the end of CORREL Function blog.
Thank you for reading.
