In one of our earlier blogs, we performed the implementation of the STDEV.P Function. The STDEV.S function in Excel is a very important Statistical Function. The STDEV.P and STDEV.S Functions came into existence in Excel 2010 and can be used in later versions.
So let’s get started.
When to Use STDEV.S Function in Excel?
The STDEV.S represents the standard deviation for a sample of data. STDEV.S function calculates the standard deviation of a sample of values taken from a population. The Standard deviation is a measure of the dispersion of numerical values from their mean value.
We can use the STDEV.P function if the data represents the whole population.
How do We get the Standard Deviation of a Sample?
Let us suppose we have a sample of n numerical values represented by x1,x2,x3…… xn.
Here x̄ represents the average of these values which is given by the formula:-
x̄ =(x1+x2+x3……+ xn)/n
Thereafter we calculate the deviation of each value of the sample from the mean of the sample.
(x1– x̄), (x2– x̄) , (x3– x̄) ……….(xn– x̄)
When we divide the sum of the square of these deviations by n-1, then it gives the value of the variance of the sample.

Where S2 represents variance and the value of I goes from 1 to n.
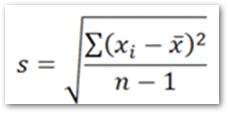
The square root of variance gives the value of the standard deviation of the sample.
The general formula to calculate the standard deviation of a sample is given by the following equation.

We can perform all these calculations in a few clicks with the use of the single function STDEV.S
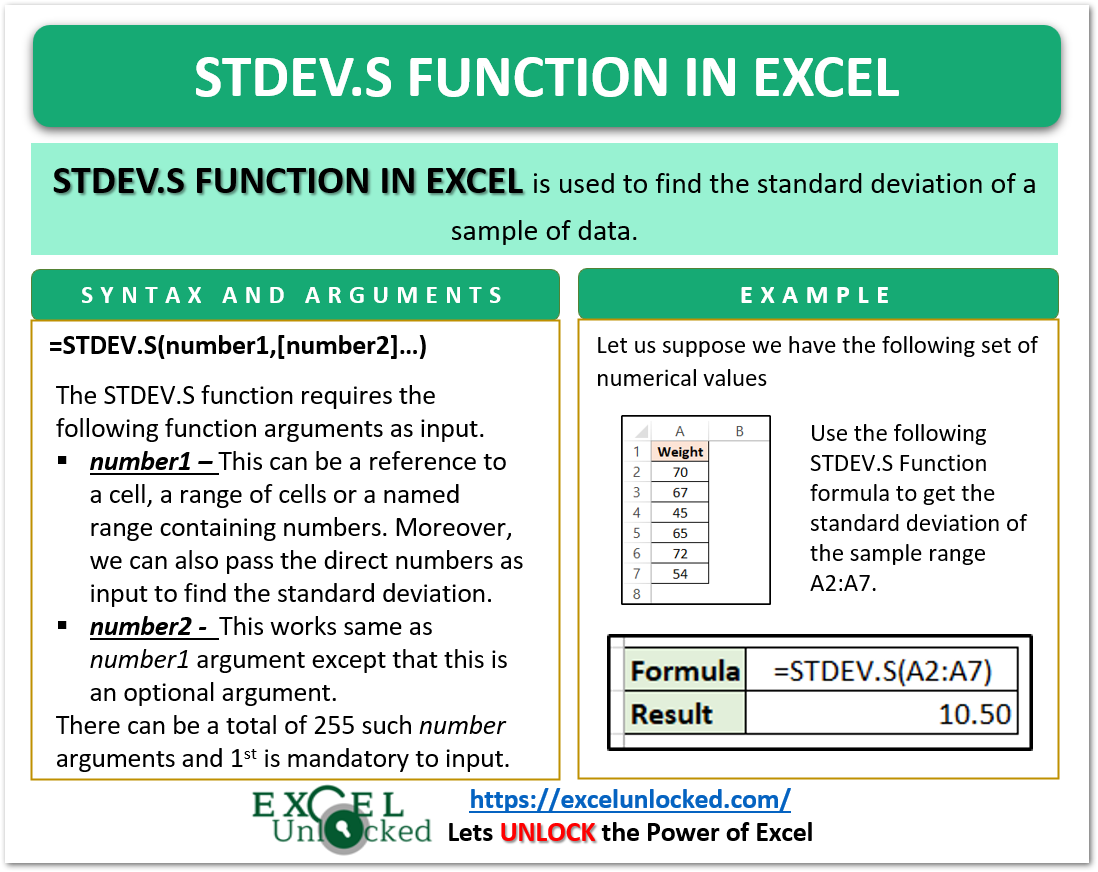
STDEV.S formula inputs the x1,x2,x3…… xn and returns the value of the standard deviation of the sample.
Syntax and Arguments
=STDEV.S(number1,[number2]……..)
The following points will explain to you the function input required by the STDEV.S formula.
- number1 – This is the set of numerical values in the sample. It can possibly be a cell reference or a value of a range of values whose standard deviation we want to find. Moreover, we can also pass the hard-coded numbers directly.
- [number2] – This is an optional argument.
We can input 255 total number of STDEV.S function arguments.

Example to Implement STDEV.S Function
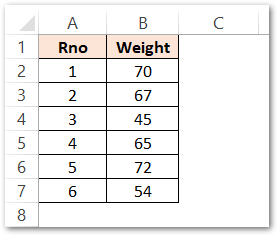
Let us suppose we have the following values of the weight of students in a class.

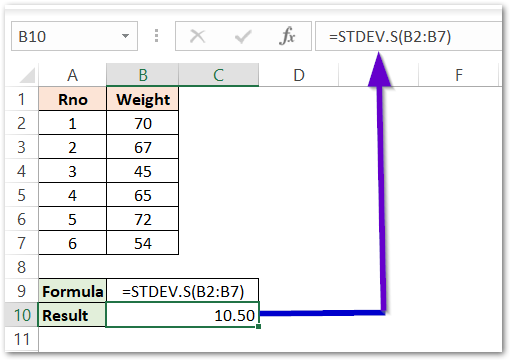
We want to calculate the dispersion of these weights from the average weight of this sample. Use the following STDEV.S formula to get the value of the standard deviation of this sample.
=STDEV.S(B2:B7)

As a result, the formula returns the Standard Deviation of weights as 10.5 Kg.
Explanation – We have passed the range B2:B7 as the number1 argument of STDEV.S Function. The input range contains the weights of different students. STDEV.S function measures the dispersion by using the standard deviation method and we got the result of 10.50 kg.
Essential Points about STDEV.S Function
You should always remember the following notes regarding STDEV.S Formula.
- The STDEV.S calculates the standard deviation of the sample of data. Use the STDEV.P function to calculate the standard deviation of the whole population.
- STDEV.S function is a replacement for the older STDEV function. Microsoft recommends using the STDEV.S Function due to compatibility reasons.
- The formula ignores the non-numerical values in the data set.
- The STDEV.S function returns #DIV/0! error if the inputted data set does not contain any numerical values.
This brings us to the end of the STDEV.S function blog.
Thank you for reading.
