In the earlier blog, we covered the STDEV.P function. VAR.P Function in excel is closely related to it. VAR.P is an essential type of statistical function of excel. So let’s start learning the VAR.P formula.
Here we go 😊.
When to Use VAR.P Function of Excel?
The word VAR.P represents Variance of Population. So you guessed correctly! VAR.P Function calculates the population variance. Variance is calculated for different values from the population set. The population set contains homogenous numerical values. Variance depicts how much the values are dispersed from the mean value.
Data with less variance is more consistent when compared to data with a high Variance value.
How is Population Variance Calculated?
Let us suppose we have a population containing n numerical values represented by x1,x2,x3…… xn.
We will start by calculating the average value of x.
μ=(x1+x2+x3……+ xn)/n
Thereafter, we will calculate the deviation of each numerical value x1,x2,x3…… xn from the population mean μ.
(x1– μ), (x2– μ) , (x3– μ) ……….(xn-μ)
The sum of the square of these deviations, when divided by n ( total number of numerical values ) gives the value of variance.
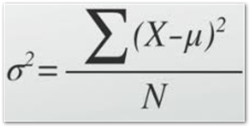
Where σ2 represents variance.
The square root of population variance gives the standard deviation of a population.
We can perform all these calculations in a few clicks with the help of the VAR.P Formula.
Syntax and Arguments
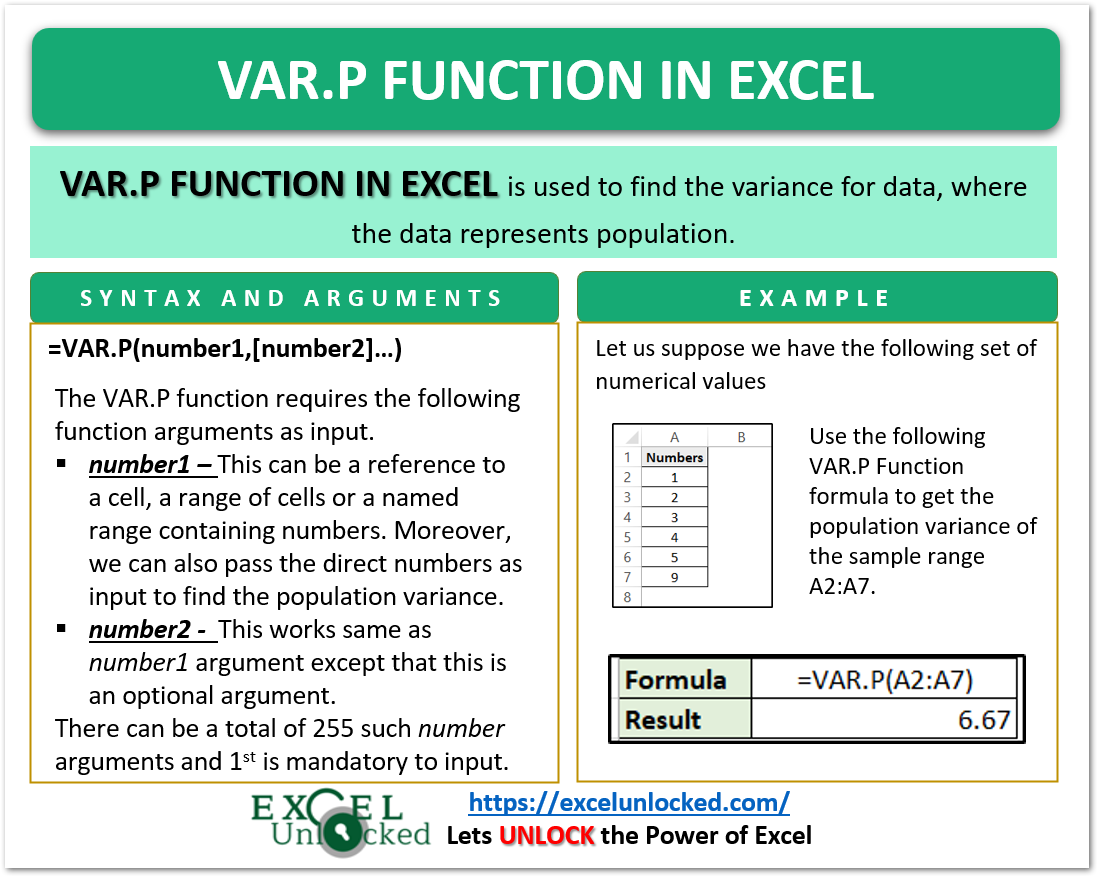
=VAR.P(number1,[number2]……)
The following points would explain to you the inputs required by VAR.P Function.
- number1 – This is a numerical value of the population set. It can be a cell reference or a range.
- [number2] – This is an optional VAR.P input argument.
VAR.P Function can have 255 such total number arguments. Out of which only the first number1 argument is mandatory to supply.
Also Read: VAR.S Function in Excel – Variance of Sample
Important Points about VAR.P Function
One must remember the following points about the VAR.P function for successful implementation.
- The square of standard deviation gives the value of variance. The result of the STDEV.P function when raised to power 2 gives the result same as VAR.P Formula for the same inputs
- If the Data represents any sample, use VAR.S Function.
- VAR.P only evaluates numbers in references, ignoring empty cells, text, and logical values like TRUE or FALSE.
- The function was introduced in Excel 2010. Use the VAR function for earlier versions of excel.
- Use the VAR.S Function when the data represents a sample.
Examples to Implement the VAR.P Function
In this part of the blog, we would perform the experimentation with the VAR.P formula.
Example 1 – Calculating Population Variance using Hard Coded numbers
We will start implementing the formula for direct numerical values.
Let us suppose we have the population set containing 5 numbers as {1,2,3,4,5,9}
Use the following VAR.P Formula to get the variance of this population.
=VAR.P(1,2,3,4,5,9)
Alternatively, you can also supply the population set as an array of numbers in brackets.
=VAR.P({1,2,3,4,5,9})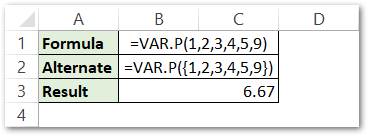
As a result, the formula returns the value of variance as 6.67
Explanation – In the first formula, we have passed the numbers 1,2,3,4,5 and 9 as the number1, number2, number3, number4, number5, and number6 function argument of VAR.P Function.
We have alternatively, passed an array of numbers {1,2,3,4,5,9} as the number1 argument of the VAR.P formula,
In both cases, the VAR.P Function evaluates the variance which comes out to be 6.67
Example 2 – Calculating Variance of Sales using VAR.P Formula
Let us suppose we have the monthly sales of a business for five years.
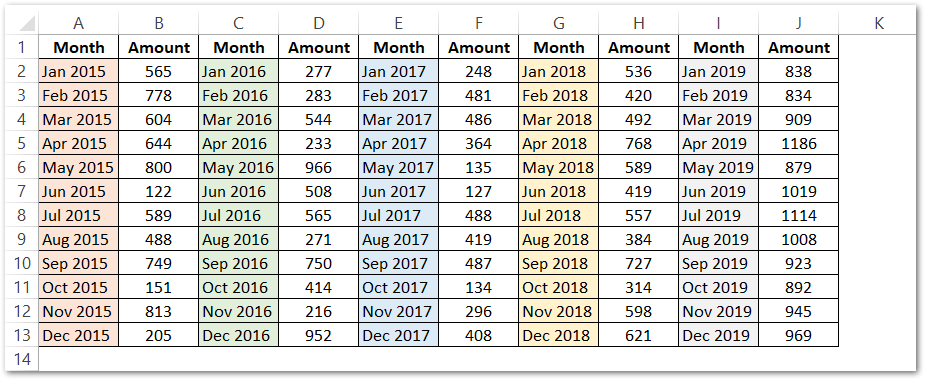
Here we have the sales for 2015, 2016, 2017, 2018 and 2019.
We want to know the year with the most inconsistent sales
We can find this by calculating the variance of the five years sales.
Use the following formula in cell B14.
=VAR.P(B2:B13)
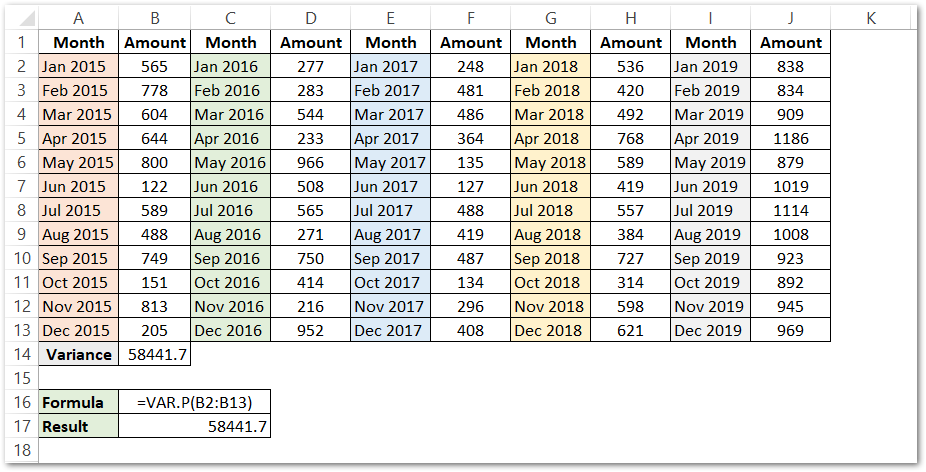
As a result, the formula calculated the Variance of Sales of 2015 as 59441.7
Explanation – We have passed the sales of 2015 as the number1 argument of the VAR.P Formula.
Range B2:B13 contains the sales for the year 2015.
Similarly, we can calculate the sales variance for 2016, 2017, 2018 and 2019.
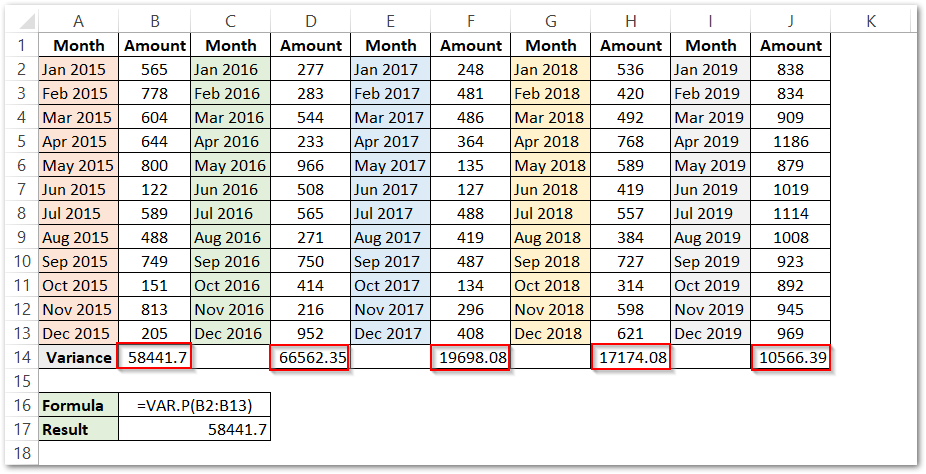
In comparison, we find that the sales variance for the year 2016 is the highest.
Therefore, the sales of the year 2016 are most inconsistent.
This brings us to the end of the VAR.P function blog.
Thank you for reading.
