In the earlier blogs, we implemented the CHISQ.DIST Function. In this blog, we will now learn another related function known as CHISQ.DIST.RT. Let us see how it works.
When to Use CHISQ.DIST.RT Function?
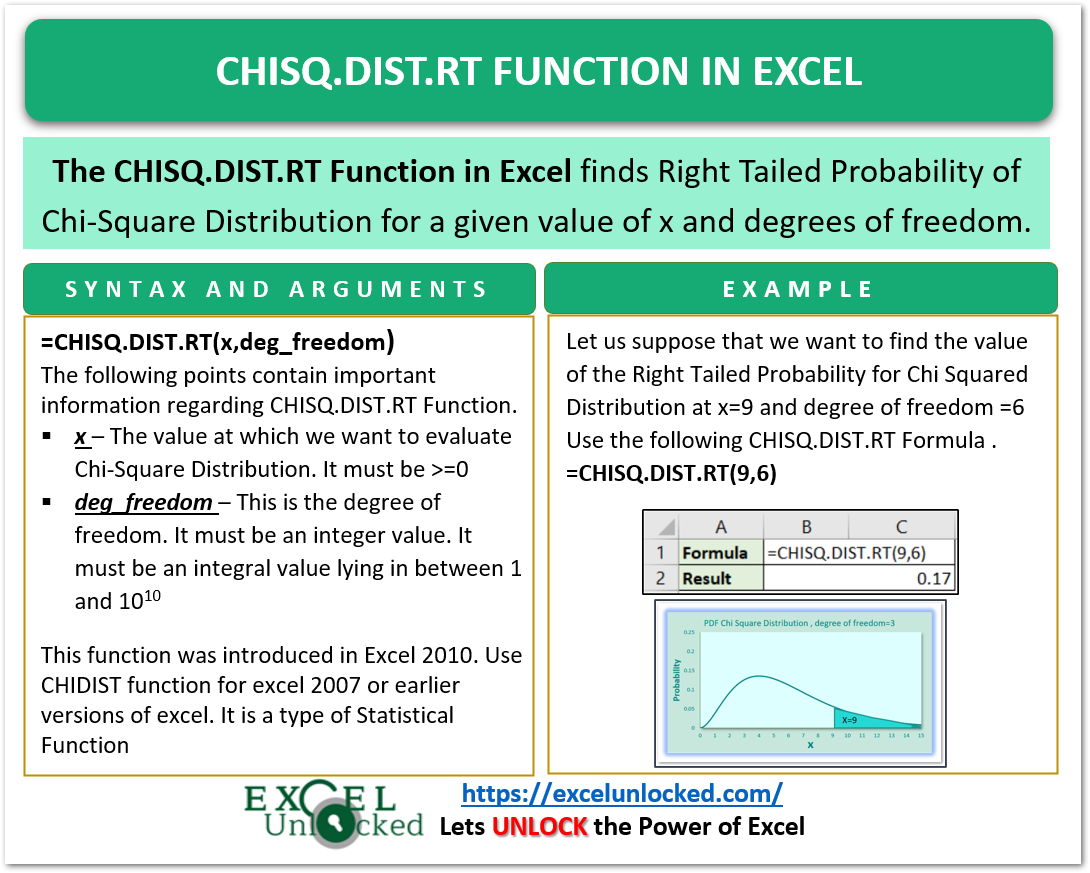
The CHISQ.DIST.RT word represents Right Tailed Chi Squared Distribution. The CHISQ.DIST.RT Function in excel calculates Right Tailed Probability of Chi-Square Distribution for a given value of x and degrees of freedom.
The Chi-Square Distribution is important to know the goodness of fit, the independency of two data series, and the contingency table. If we get a small value of χ2 distribution, then there is not much relationship between the two variables.
The CHISQ.DIST.RT Function came into existence in 2010. You can use CHIDIST Function for excel 2007 or earlier Excel versions. It is an essential type of statistical function.
What is Right Tailed Probability of Chi Square Distribution?
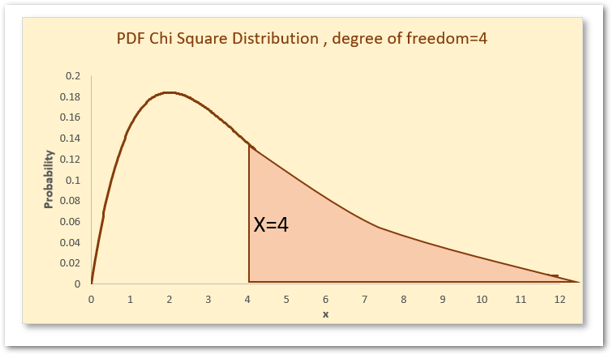
We have constructed a Probability Density Function graph of Chi Squared distribution when the value of degrees of freedom = 4. This is constructed using the CHISQ.DIST Formula.

The area under the probability density curve is always equal to 1. Here, the shaded area under the curve is for the right-tailed probability at x=4. Tail refers to which side of the graph, we are considering the results. This is for x>=4.
This area under the curve can be calculated with the help of CHISQ.DIST.RT Function formula because it is an example of Right Tailed Probability as x>=4.
Syntax and Arguments
=CHISQ.DIST.RT(x,deg_freedom)
The following points contain the necessary information about the inputs required by CHISQ.DIST.RT Function.
- x – This is the value at which we want to get the value of Right Tailed Probability Distribution. It must be greater than or equal to zero.
- deg_freedom – The value of the degree of freedom decides the shape of the curve of the graph we plotted earlier. It must be an integral value lying between 1 and 1010

Examples to Implement CHISQ.DIST.RT Function
In this section of the blog, we would implement some examples to learn the CHISQ.DIST.RT Function.
Example 1 – Basic Example Explained with Graph
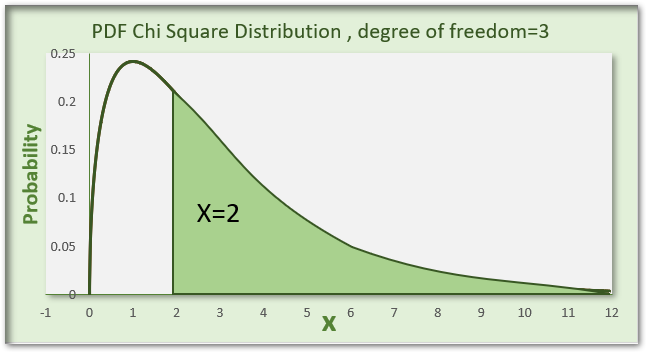
Let us suppose we want to get the value of Right Tailed Probability when the degree of freedom is 3 and x=5. Use the following CHISQ.DIST.RT Formula for getting the value of the One-Tailed Test.
=CHISQ.DIST.RT(2,3)

As a result, we get the value of 0.57.
Explanation – We have supplied the value of x as 2 and the degree of freedom as 3. The function calculates the value of Right Tailed Probability. This answer represents the following area under the curve of the Probability Density Function of Chi Square Distribution.

Example 2 – Another Example for Right Tailed Test, Chi-Squared Distribution
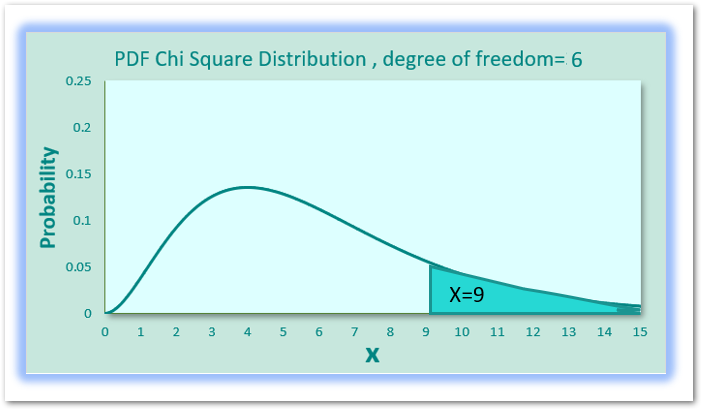
Let us suppose we want to get the value of Right Tailed Probability at x=9 when the degrees of freedom =6. Use the following CHISQ.DIST.RT formula.
=CHISQ.DIST.RT(9,6)

Consequently, we get a value of 0.17 as result. This is Righ-Tailed Probability representing x>=9 for the degree of freedom = 6.
This answer represents the following area under the graph of chi-squared distribution for the degree of freedom=6.

This brings us to an end of CHISQ.DIST.RT Function blog.
Thank you for reading.
