In the previous blog, we did the usage of the MODE Function in Excel. The FREQUENCY Function is also an essential type of Statistical Function. The Function is used in statistical analysis. Let’s understand the working of the FREQUENCY Function in Excel.
When to Use FREQUENCY Function in Excel?
The FREQUENCY Formula is used in the frequency distribution of values. The values are categorized into different bins with different frequencies. Frequency distribution refers to a list containing bins. The corresponding number of values falling in each bin is called the frequency of that bin.
For Example, if we have the weights of different students in a class, then we can form bins like:-
| Weight | Number of students |
| <40 | 2 |
| 40-50 | 14 |
| 50-60 | 17 |
| >60 | 6 |
Here the students are categorized into these bins created on the basis of their weights.
The FREQUENCY Function provides the value of frequency for each bin
Syntax and Arguments
=FREQUENCY(data_array,bins_array)
The following points will explain to you the input parameters required by the FREQUENCY Function:-
- data_array – We supply the source range of values whose frequency distribution we want to get. It can be a reference to a cell, a range, or a named range
- bins_array – This is the range of upper limits of our bins. The bins work on the upper limits of each bin category. For example:-
| Bin ( upper limit ) | bin storage |
| 10 | not more than 10 |
| 20 | between 10 and 20 ( not more than 20 ) |
| 30 | between 20 and 30 ( not more than 30 ) |
| NULL | greater than 30 ( greater than 30 and no upper limit ) |
Points to Remember About FREQUENCY Function
The following points about the FREQUENCY Formula must be kept in mind before actual usage of the function:-
- If you are using MS Excel 2019 or any earlier version of Excel, then once you type the FREQUENCY Formula in the cell, you need to press the Ctrl Shift Enter key. This is so because FREQUENCY Function is a CSE Formula.
- If you are using Excel 2021 or Microsoft Excel 365, then there is no need to press the Ctrl Shift Enter key. You can type the formula in the cell and then press Enter key. It works as a dynamic array formula.
- The FREQUENCY Formula works on ranges (groups of cells).
We are using Excel 2021 for FREQUENCY Formula. In Excel 2019 or earlier version, just press Ctrl Shift Enter key after typing the FREQUENCY formula. This will split the frequency distribution result into a range of cells.

Example – Frequency Distribution for Student Marks
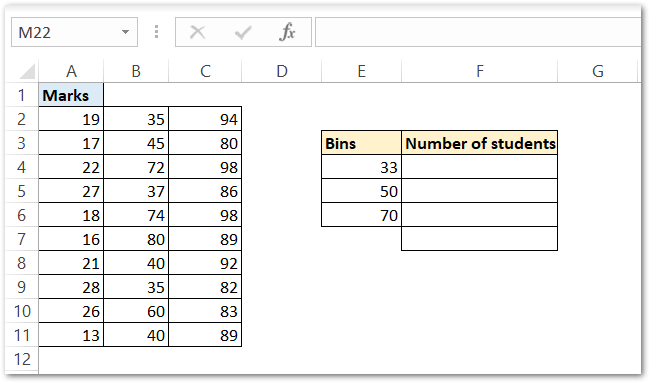
Let us say we have the class test marks of thirty students of a class as follows:-

Use the following formula in cell F5.
=FREQUENCY(A2:C11,E4:E6)
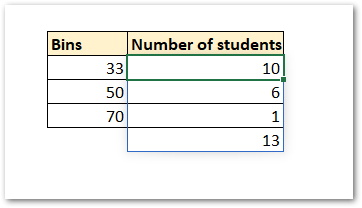
After typing the formula in cell F5, press Ctrl Shift Enter key to get the results ( For Excel 2019 and earlier versions ). If you have Excel 2021 or Excel 365 then simply press Enter key. The total number of students would be distributed into the bins as follows:-

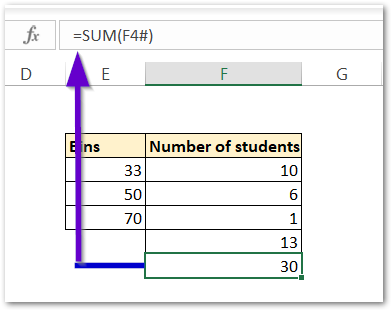
Here you can see that we have got the frequency distribution of the total number of students. If you add the values in the range F4:F7, then this sum must be equal to 30. To know why the sum contains the formula =SUM(F4#), click here.

Explanation – We pass the range A2:C11 as the data_array and E4:E6 as the bins_array argument of the FREQUENCY Formula. The frequency of the first bin is 10. So there are 10 students whose marks are either less than or equal to 33.
The next bin is of 50 marks which basically contains the number of students whose marks are (33<x<=50) greater than 33 but less than or equal to 50. So there are 6 such students.
The third bin is for 70 marks in which we have the frequency of the students who scored more than 50 marks but less than or equal to 70 marks. We have only one such student on the list.
There is one extra frequency result. There are three bins but the frequencies are four. This is so because the bins are nothing but the upper values. For the last bin, the upper value is always infinity (NULL). Thus the last frequency represents the number of students who scored more than 70 marks. i.e x>70. There are 13 students who scored more than 70 marks in the test.
This brings us to the end of the blog.
Thank you for reading.
