
The previous article covered the basics of adding and customizing Data Bars. Today we will learn how to define the min and max values of data bars in excel. We would also add data bars based on the formula.
So let us begin learning.
How to Define the Min and Max values of Data Bars?
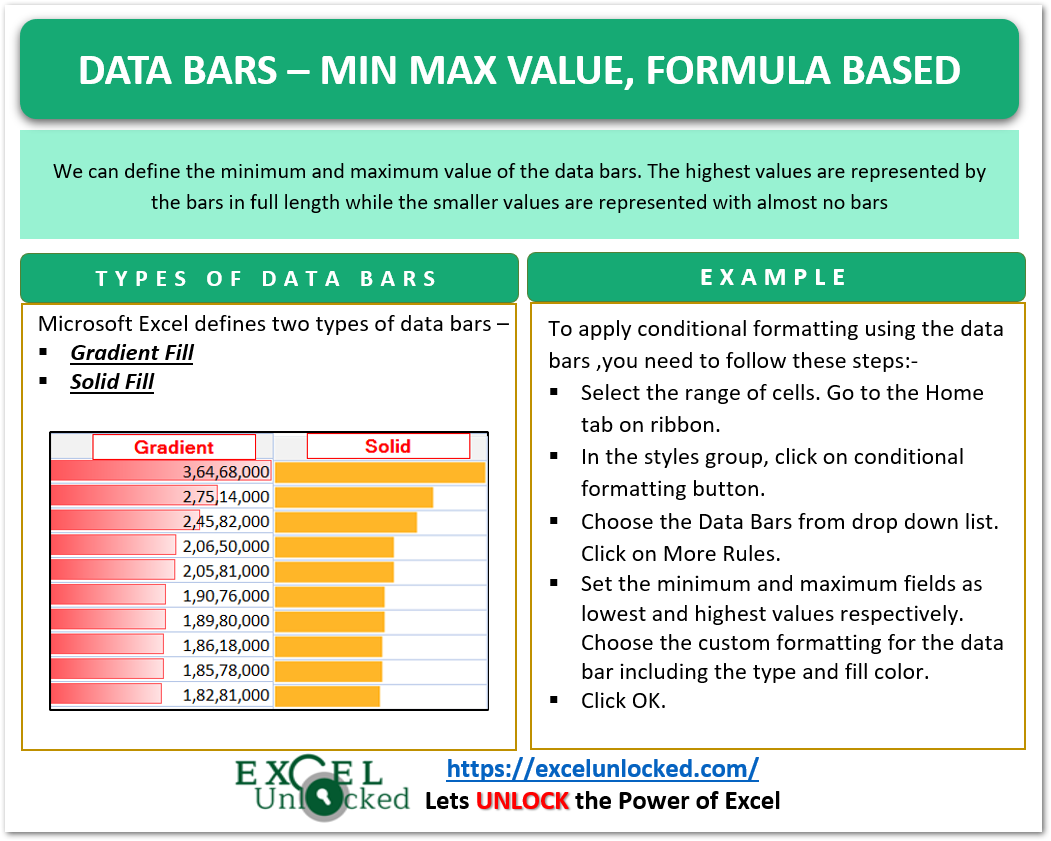
We can define the minimum and maximum value of the data bars so that the highest values are represented by the bars in full length while the smaller values are represented with almost no bars. You can download the practice workbook to practice along with this article.
To do this:-
- When you have existing data bars, select the range of cells, go to the conditional formatting button in the home tab, and click on the manage rules option. Find the rule for data bars and click on the edit button.
- If you want to apply new data bars from scratch, Select the range of cells you wish to add data bars to. Click on the conditional formatting button and find the option for the new rule.

- This opens the New Formatting Rule dialog box. Choose Data Bars in the Format Style Field

- Set the minimum and maximum fields as lowest and highest values respectively. Choose the custom formatting for the data bar including the type and fill color.

How to Use Data Bars with Formula?
It is very easy to insert data bars in excel with their minimum and maximum values based on some formula. For example, we can use the MIN and MAX Functions in the formula and then customize the function formula as per our needs. To do so:-

- Select the range of cells you want to add data bars. Go to the New Rule option in the Conditional Formatting menu in Home Tab.
- Choose the Format Style as Data Bars. Set the Minimum and Maximum type to Formula.
- Use the following formula in the Minimum and Maximum Value Fields.
=MIN($C$4:$C$13)*0.8
=MAX($C$4:$C$13)*1.2
- Select custom formatting for the data bars and click OK.
The minimum value for data bars represented with zero length would be for 20% less than the minimum value in the population data. Similarly, the maximum value of data bars of full length would only be used for values 20% greater than the maximum population value.
Also Read: Data Bars in Excel – Add and Customize

The actual population data has a maximum value of 3,64,68,000 whereas the data bar would be of full length for 3,64,68,000*1.2 (20% more). Therefore, the largest population value (3,64,68,000) would not be represented with a complete length bar while the smallest population value data bar would not be of zero length as the zero length bar is assigned to 1,82,81,000*0.80 ( 20% less than 1,82,81,000 ).
This was all about data bars in excel.
This brings us to an end. Thankyou for reading.