In the earlier blog, we learned the making of a static Waffle Chart in Excel which is nothing but a normal Waffle chart with zero interactions. If you have never made a Waffle Chart, then We highly recommend you to read the article for a normal Waffle Chart before you start making the interactive one!
Why do We Need a Dynamic Waffle Chart?
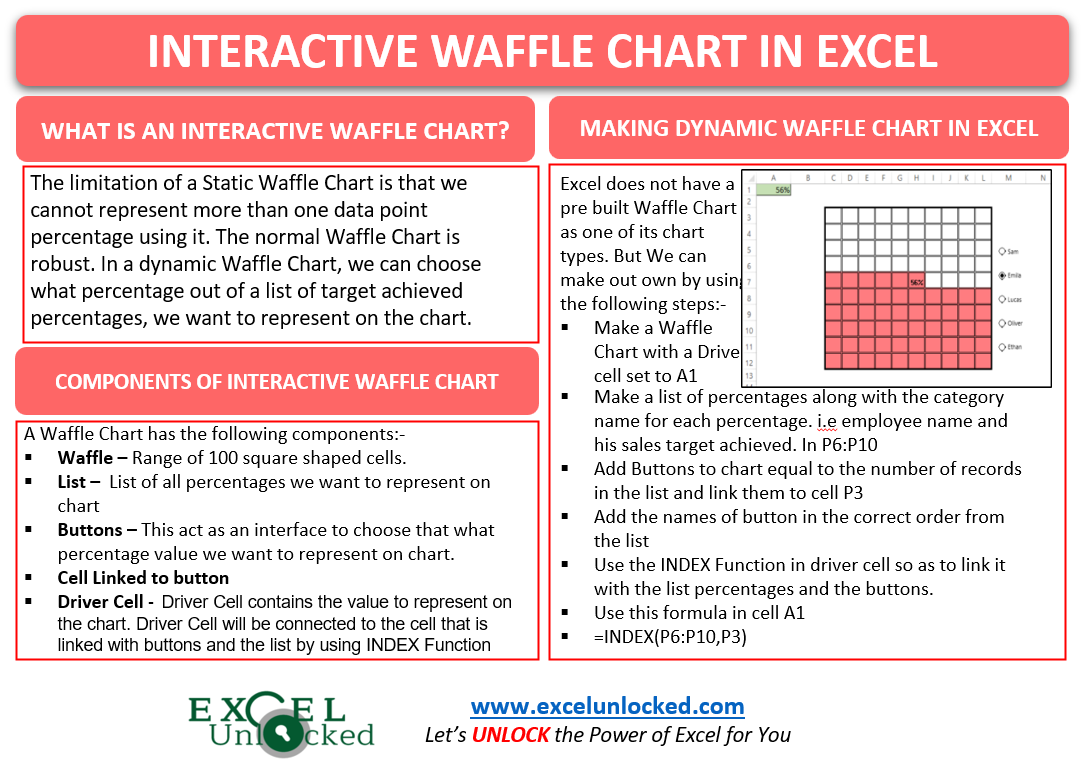
The limitation of a Static Waffle Chart is that we cannot represent more than one data point percentage using it. The normal Waffle Chart is robust. In a dynamic Waffle Chart, we can choose what percentage out of a list of target achieved percentages, we want to represent on the chart.
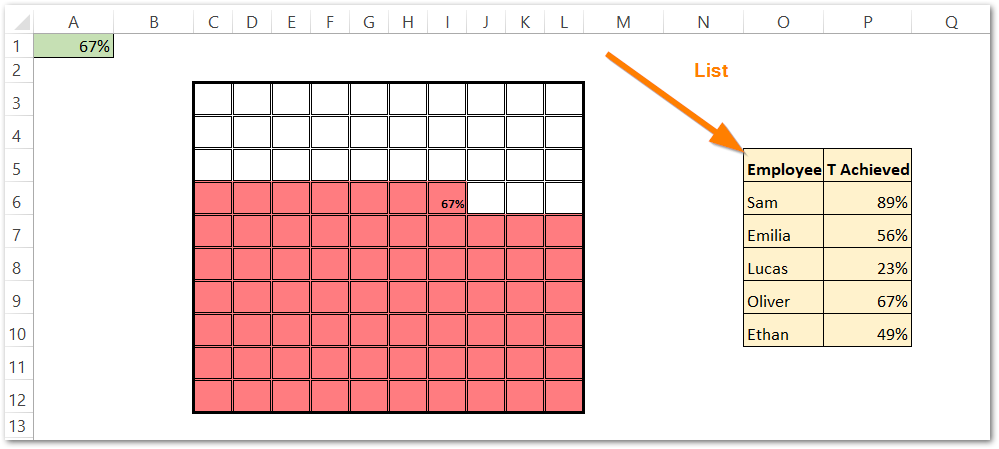
Components of an Interactive Waffle Chart
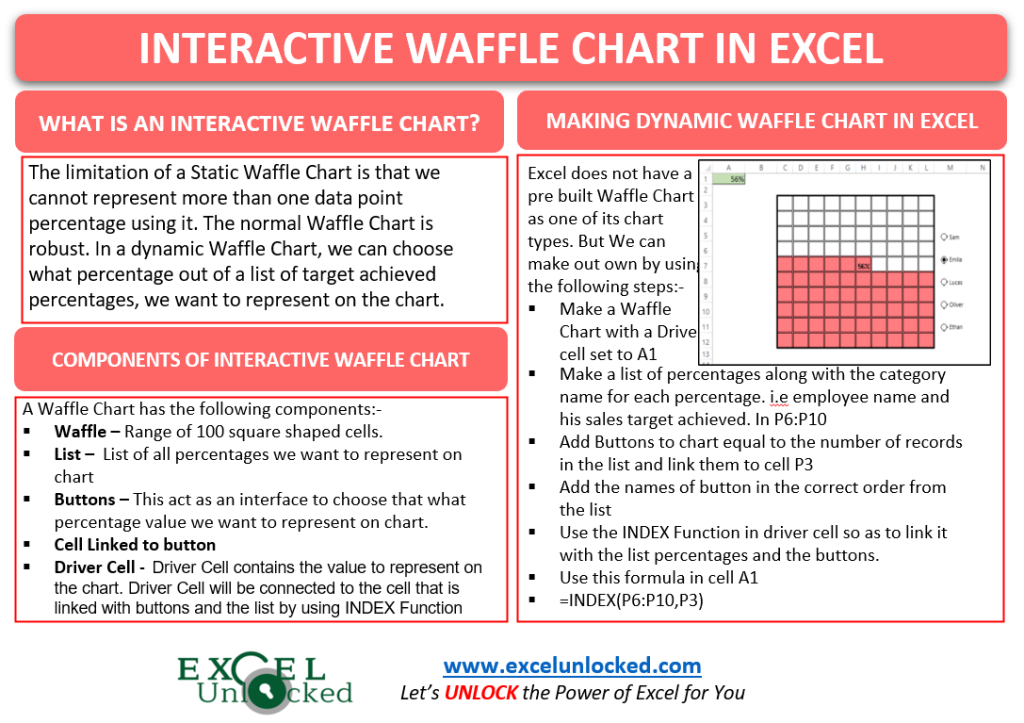
An Interactive Waffle Chart is made up of the following components:-
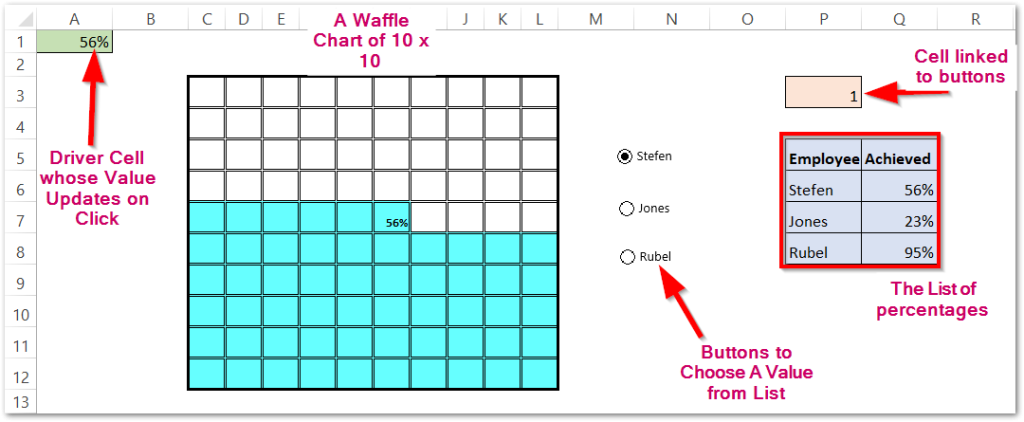
- Waffle – This is a range of hundred square shape cells that will make the actual Waffle Chart.
- List – This is the list of all percentages that could be represented via the Waffle Chart.
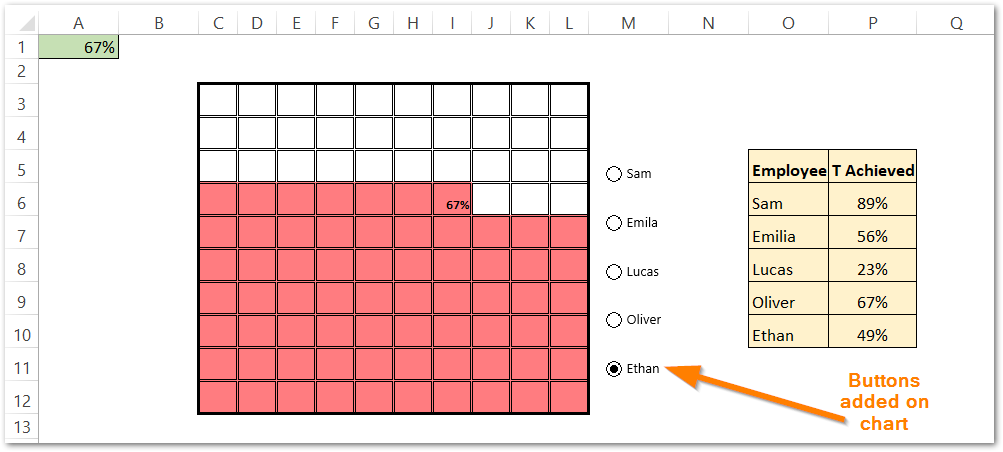
- Buttons – These buttons act as an interface to choose an option from the list that will be represented on the Waffle Chart.
- Cell Linked to buttons- This cell will be linked to buttons and it contains the button order which is currently marked.
- Driver Cell – Driver Cell contains the value to represent on the chart. Since the chart is interactive, the value to represent depends on which option we have marked from the buttons. The Driver Cell will be connected to the cell that is linked with buttons (P3) and the list by using the INDEX Function.
Working of an Interactive Waffle Chart in Excel
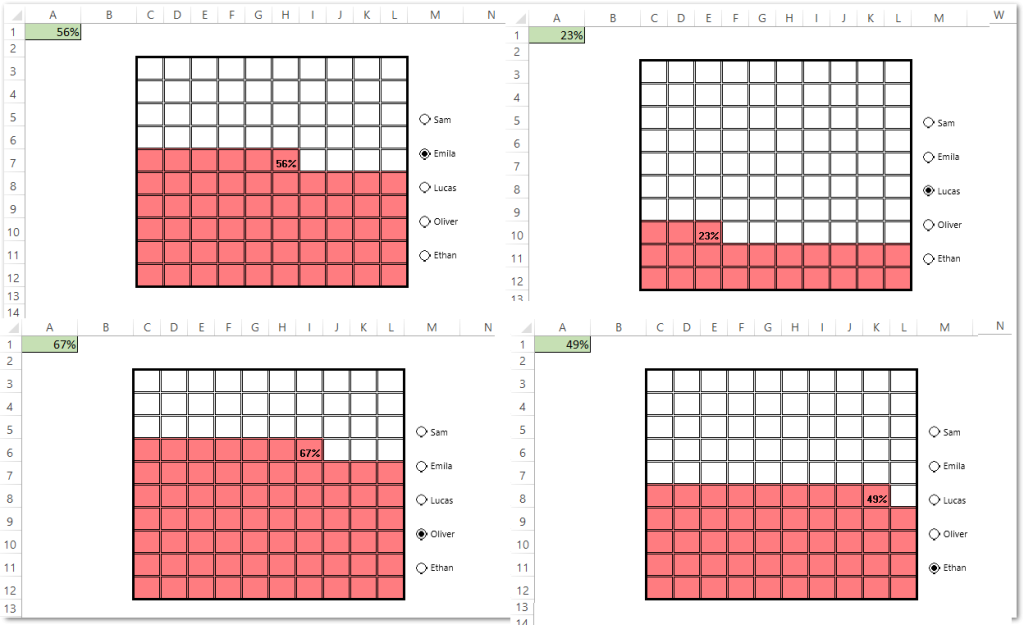
This chart works as follows:-

These are the three states of the same chart that appear on marking a particular option from the buttons.
Making an Interactive Waffle Chart in Excel
We need to have a static Waffle Chart prepared and then we will make it interactive.
Creating a Static Waffle Chart in Excel
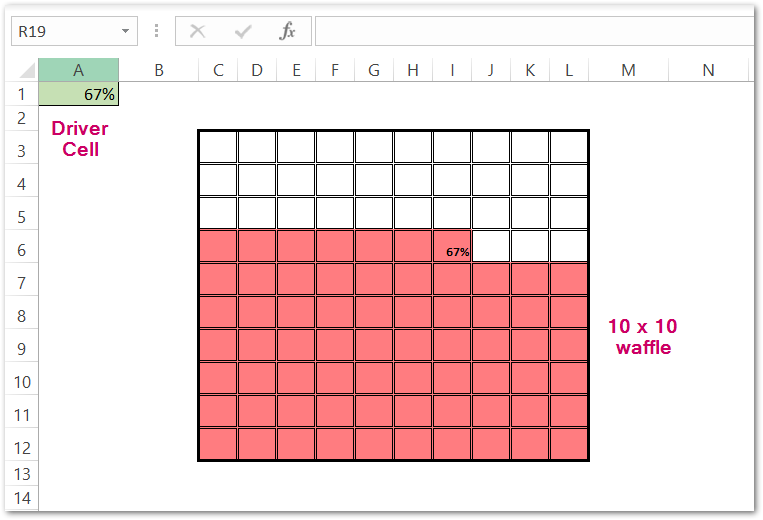
A static Waffle Chart has a Grid of hundred square-shaped cells along with the driver cell. If you have never created a static waffle chart before, then do not worry.
Click here to learn the making of a Base Waffle Chart.
The chart is as follows:-
Creating the List of Percentages
Let us suppose we have the names of different employees of a company along with their monthly sales target achieved. Enter them in the current worksheet as follows:-
Adding Buttons
In this section, we will add buttons to make the chart interactive. Since the list we took has five employees, we will need to have five buttons so as to have one button assigned to each employee.
To add a Button:-
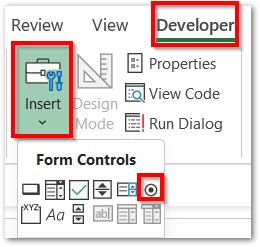
- Go to the Developer tab on the ribbon.
- Click on the Insert button under the Control button.
- Select the button and drag your cursor on worksheet to place that button.
Repeat this step five times to get five buttons. The buttons will have default text placed with them. Replace this text with the employee’s name in the appropriate order.
Linking the Buttons to cell P3
Right Click on the first button and Choose the option Format Control.
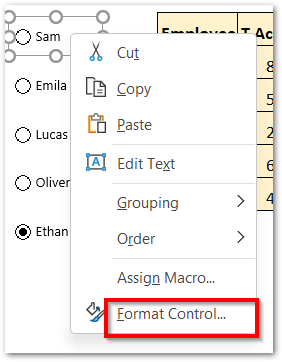
From there, add cell P3 to link it to this button.
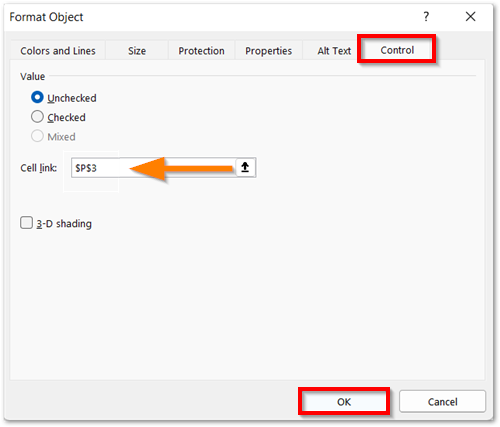
Consequently, this will link all the buttons to one cell P3.
Making the Driver Cell Work
After linking the buttons with cell P3, we can now connect the Driver Cell A1 with the range P6:P10 (Percentage List) and P3 (button-linked cell).
Enter this formula in cell A1:-
=INDEX(P6:P10,P3)
This formula will complete the Interaction with the Waffle Chart. This is how it works:-
This brings us to the end of the blog.
Thank you for reading
RELATED POSTS
- Pie of Pie Chart in Excel – Inserting, Customizing, Formatting
- Interactive Pictograph Chart in Excel – Usage, Making
- Pie Chart in Excel – Inserting, Formatting, Filters, Data Labels
- 100% Stacked Column Chart in Excel – Inserting, Usage, Reading
- Stacked Column Chart in Excel – Usage, Examples, Format, Special Gridlines
- Bullet Chart in Excel – Usage, Making, Formatting

