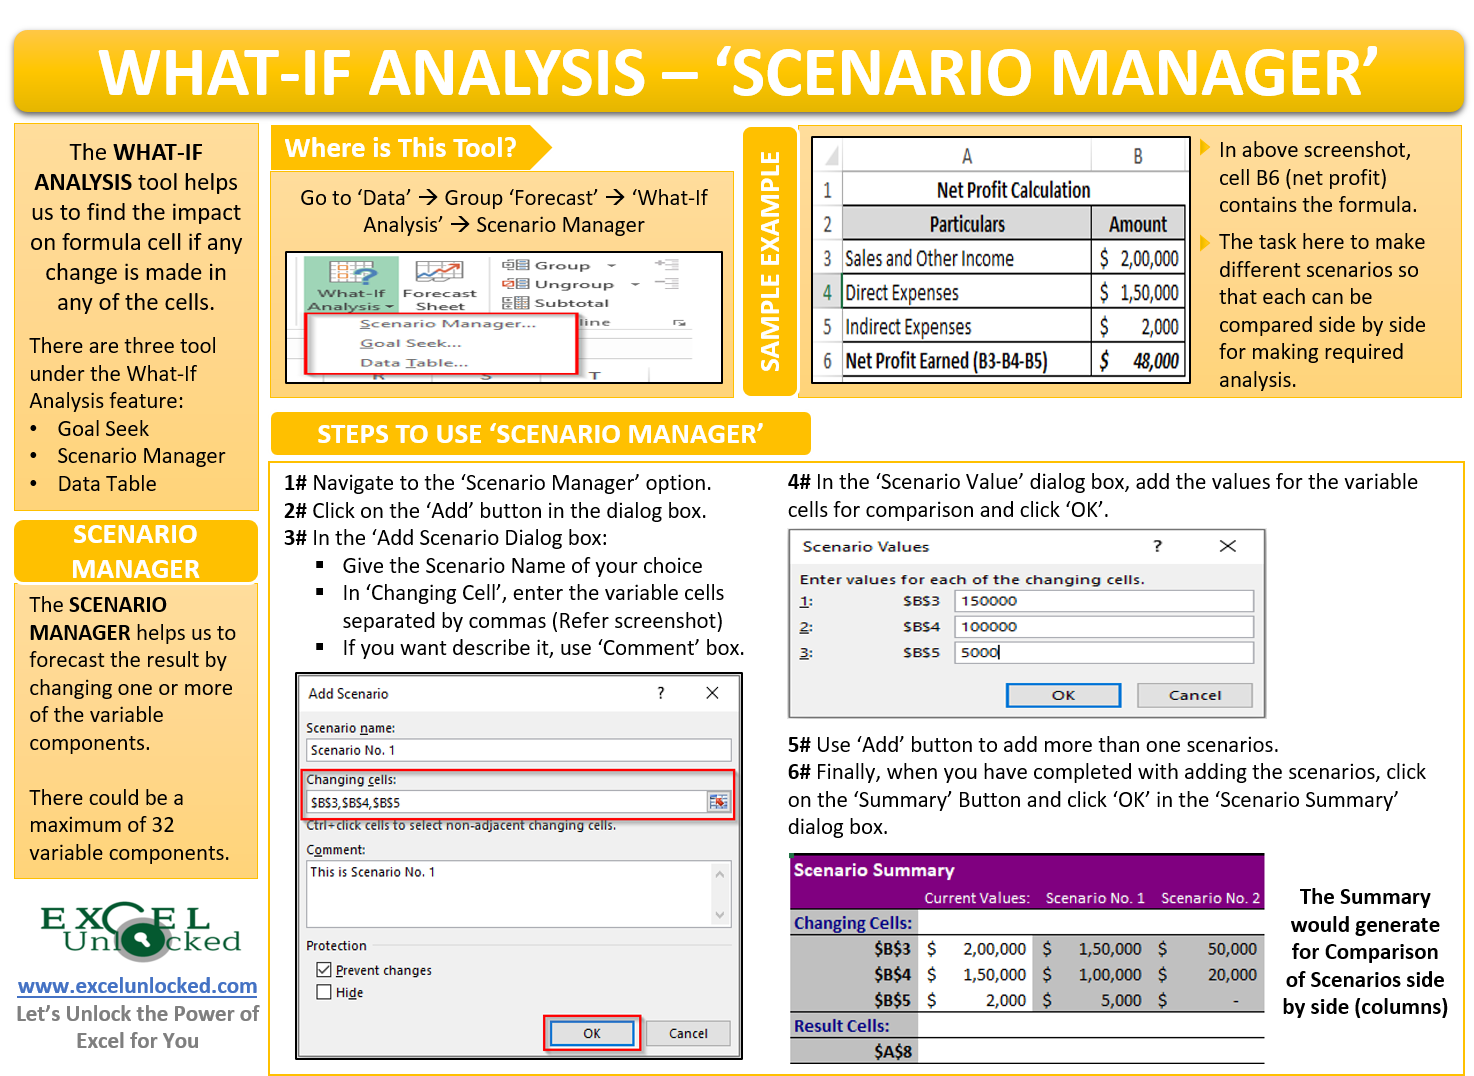
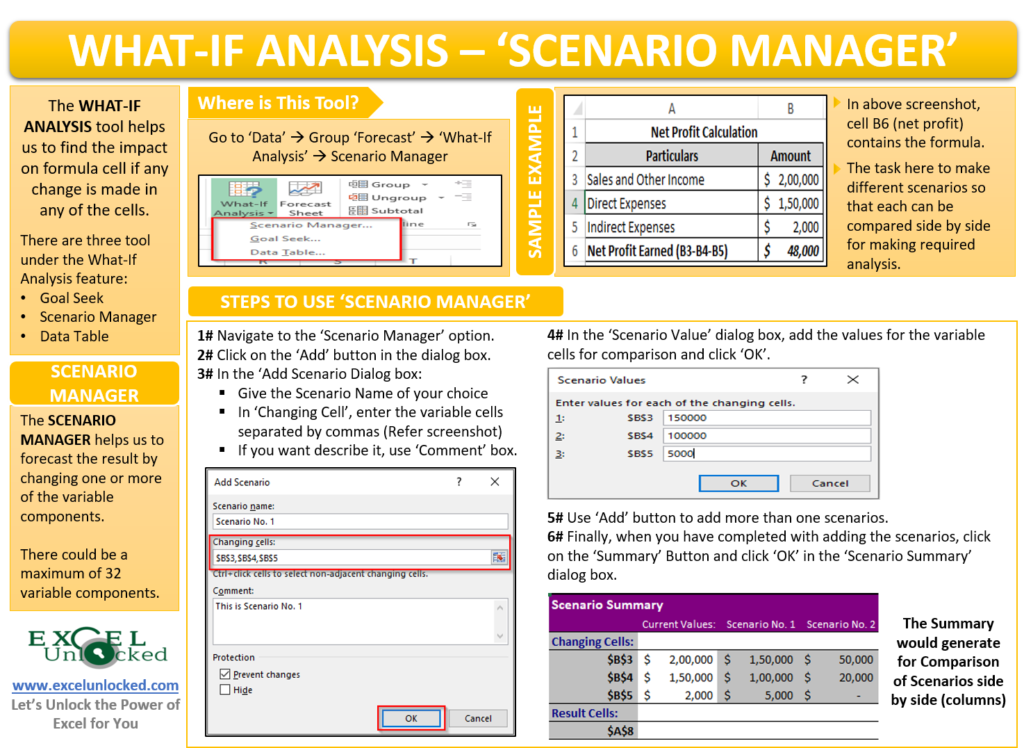
In our previous blog, we had learned about the Excel What-If Analysis Goal Seek tool. The Goal Seek feature helps us to find the value of the dependent cell to get the desired result. In this blog, we would unlock another What-If Analysis Tool called the Scenario Manager Tool in Excel. The scenario manager tool works in an exactly opposite way as that of the goal seek feature. Unlike the goal seek tool, with Scenario Manager in excel, you can find the impact on the final result or output based on different possible scenarios.
Let us take one example to understand this better.
Scenario Manager Example
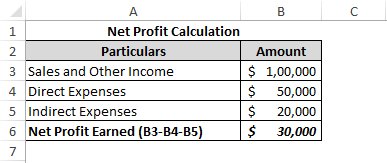
Suppose you are an accounts manager in an organization. As a part of the month-end activity, you want to make a report which shows the impact on the net profit of the organization due to any change in the dependent variables (different scenarios). Additionally, you want to keep all the scenarios side by side for the purpose of comparison.
The Excel Scenario Manager feature would help you to achieve this objective.
The net profit is determined by deducting direct and indirect expenses from the sales and other incomes. Therefore, the net profit is dependent on three components which are Sales and other incomes, direct expenses, and indirect expenses. All these three variable are known as dependent/variable components.
What is A Scenario Manager Feature?
The Scenario Manager is a What-If Analysis Tool that helps us to forecast the result by changing one or more of the variable components.
Also Read: What-If Analysis – Data Table in Excel
This tool is really helpful when there are more than two dependent variable components. Till the two components, you can use the Data Tables What-If Analysis tool.
There could be a maximum of 32 variable components.
Where To Find This Tool?
You can find this tool under the options available in the ribbon bar. Navigate to the following path:
‘Data’ Tab > ‘Forecast’ Group > ‘What-If Analysis’ Button > ‘Scenarion Manager’

How to Use Scenario Manager Feature?
Let us now learn how to use the scenario manager feature in Excel.
Navigate to the Scenario Manager feature and the dialog box would appear (as shown in the screenshot below).
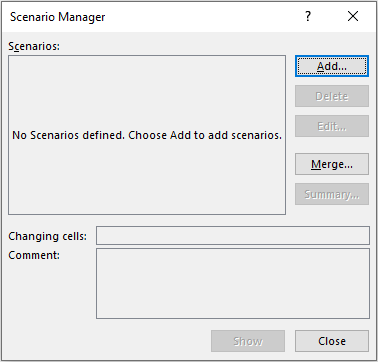
As you can see from the screenshot, at present there are no scenarios added.
Now, click on the button ‘Add’ to add the multiple scenarios.
As soon as you click on the Add button, the ‘Add Scenario’ dialog box would appear on your screen. In the ‘Scenario Name’ input field, give the name to the scenario. In the ‘Changing Cells’ input box, we need to enter the variable components cells (separated by commas).
The comment section enables you to give any additional comment that explains the scenario.
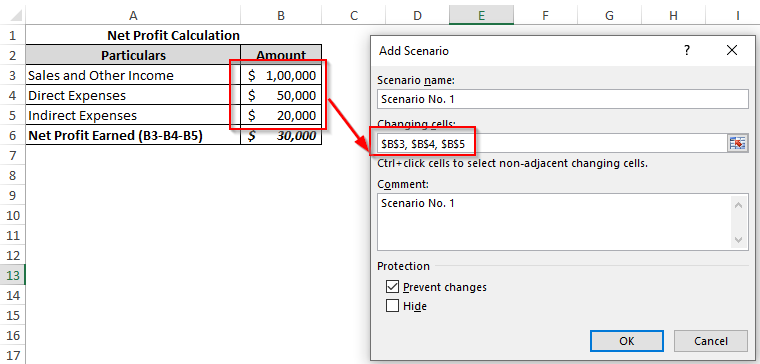
Now, click on the ‘OK’ button, and the ‘Scenario Manager’ dialog box would pop out. Enter the values that you are expecting.
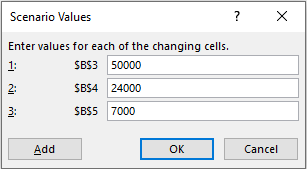
Click on the ‘OK’ button and you would be back to the ‘Add Scenario’ dialog box with the first scenario added.
Also Read: What-If Analysis – Goal Seek in Excel
Similarly, to add more scenarios, click on the ‘Add’ button again, and a dialog box would again appear where you can add more scenarios.
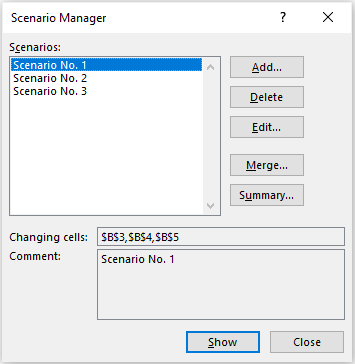
I have added two more scenarios to make you understand how this would work.
In the screenshot below, you can see that I have added three scenarios.
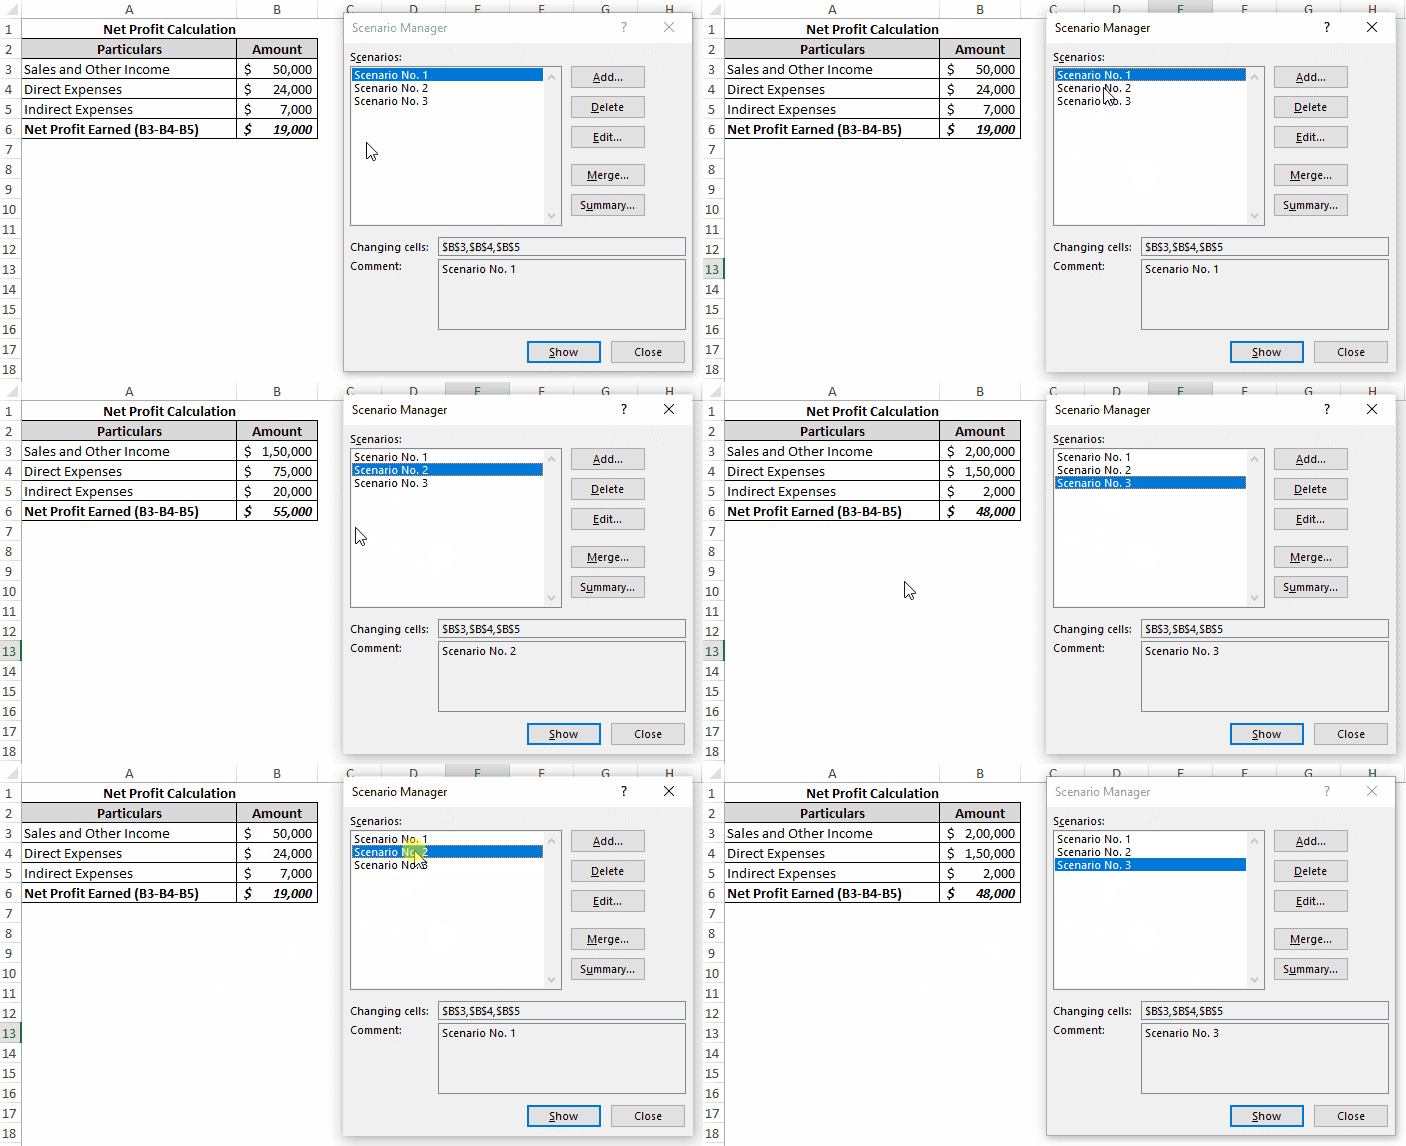
Finally, let us learn how does this functionality work.
It is very easy. Just double click on the scenario name and the values in the worksheet would update accordingly.
To edit any scenario, select the scenario name and then click on the ‘Edit’ button. A dialog box would appear, where you can make changes.
Get All Scenario Side by Side
In the previous section of this dialog box, we learned to create scenarios and also learned how by double-clicking the scenarios that value in the result cell changes independently.
But, looking at each of the scenarios independently would not help you to make any analysis.
To make an informed decision using the scenarios, you need to make a summary of all the scenarios.
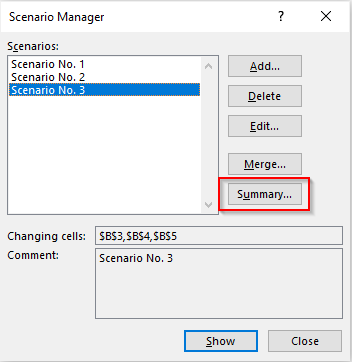
To generate a summary report, just click on the ‘Summary’ button and enter the ‘Result Cell’ (the cell reference where you want the summary to generate).
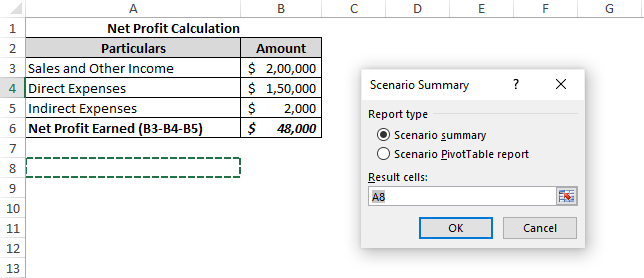
As soon as you click on the ‘OK’ button, you would notice that the excel creates a summary of all the scenarios. It keeps the different scenarios side by side in different excel columns.
Refer to the screenshot below for ‘Scenario Summary’:
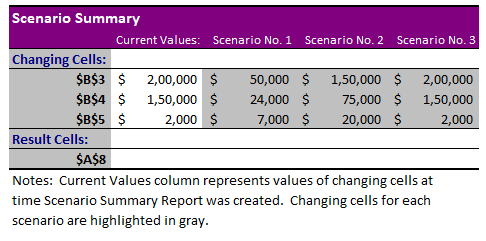
Finally, you can easily analyze and compare the different scenarios on one screen.
This brings us to the end of this blog. Share your views and comments in the comments section below.

